AN/FPQ-10 Radar System
SPECIFICATIONS
The Sperry tracking radar, AN/FPQ-10, has the following characteristics:
Type: Monopulse, missile range instrumentation tracking radar.
Power: 1 megawatt peak. There were losses in the waveguide but were
more than compensated by the +23 db (or so) gain of the antenna.
Frequency Low: 5,400 MHz
Frequency High: 5,900 MHz
Pulse Width: Selectable - 0.25 or 0.5 or 1µs
Antenna Gain: 43 dBi
PRF: 160 or 640
Azimuth: 0 to 360 degrees
Elevation: -5 to +185 degrees
Range: 200 miles
Vintage: mid 1960's
Manufactured by: Sperry Gyroscope , Great Neck, N.Y. Sperry was a division
of the Sperry Rand Corporation.
Comment: For AN/FPQ-10, F means a fixed installation;
P means radar; Q is for special or combination types; 10 is a specific
model
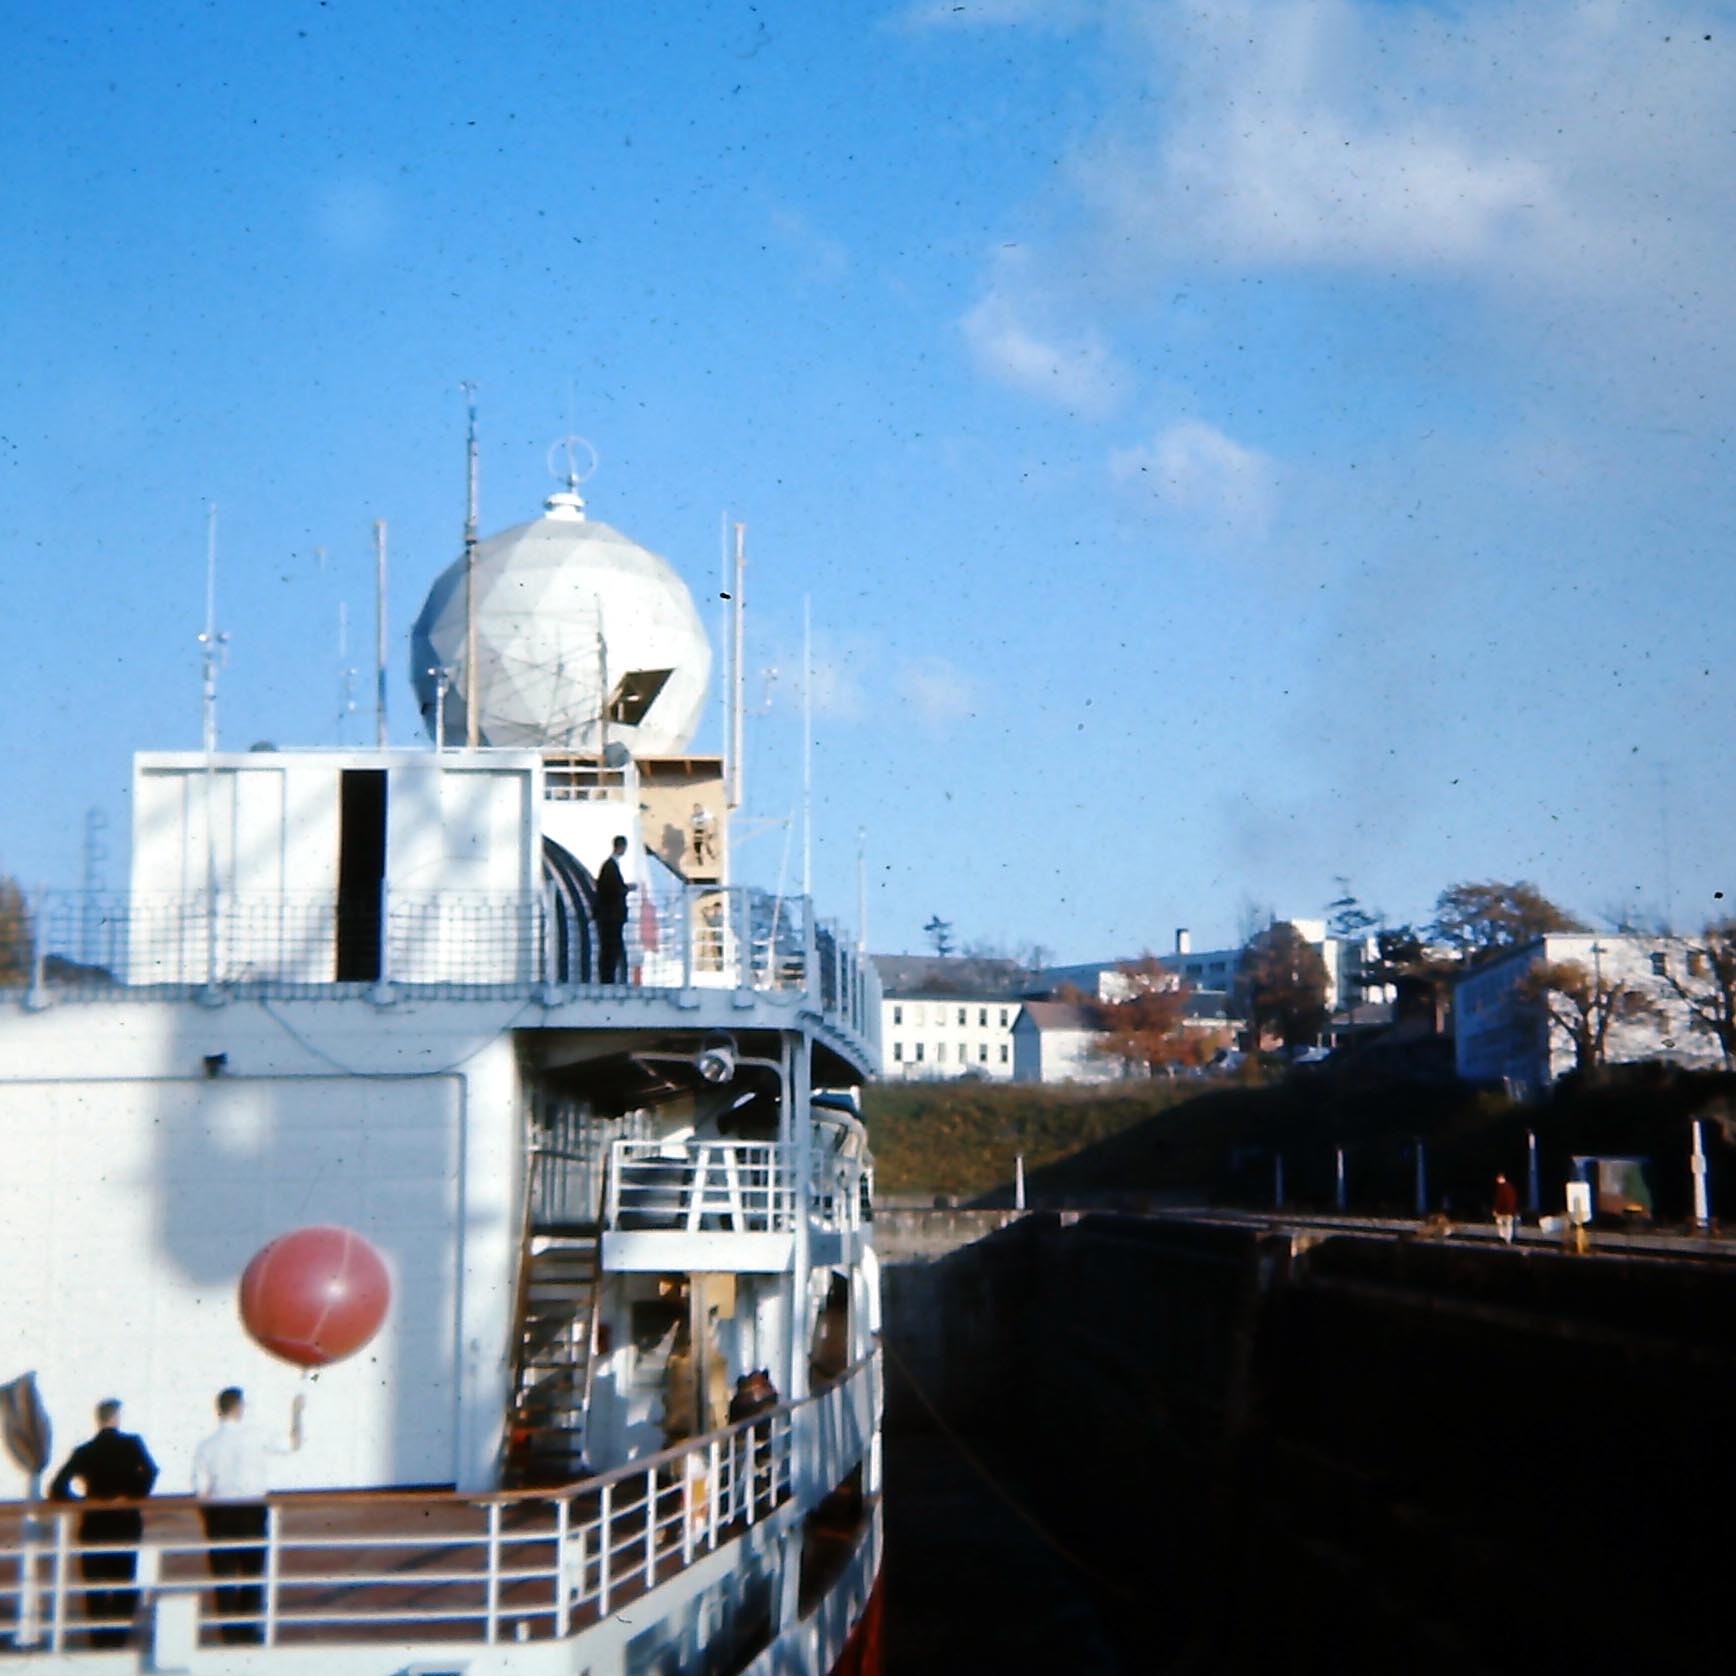
The main purpose of the FPQ-10 radar was weather balloon tracking. Navigational
use was secondary. Often, an aircraft would request a position report
to check their navigation. If no balloon launch was operating, it
would be done. If an aircraft checked in just to say hello (or what
ever) , the operator may go lookimg for him, track him, and then compare
notes with the pilot. It was surprising how accurate the Sperry FPQ-10
was. It took in the curvature of the earth in the calculations.
Sometimes it was hard to locate aircraft as the beam width was very narrow.
PHOTOS
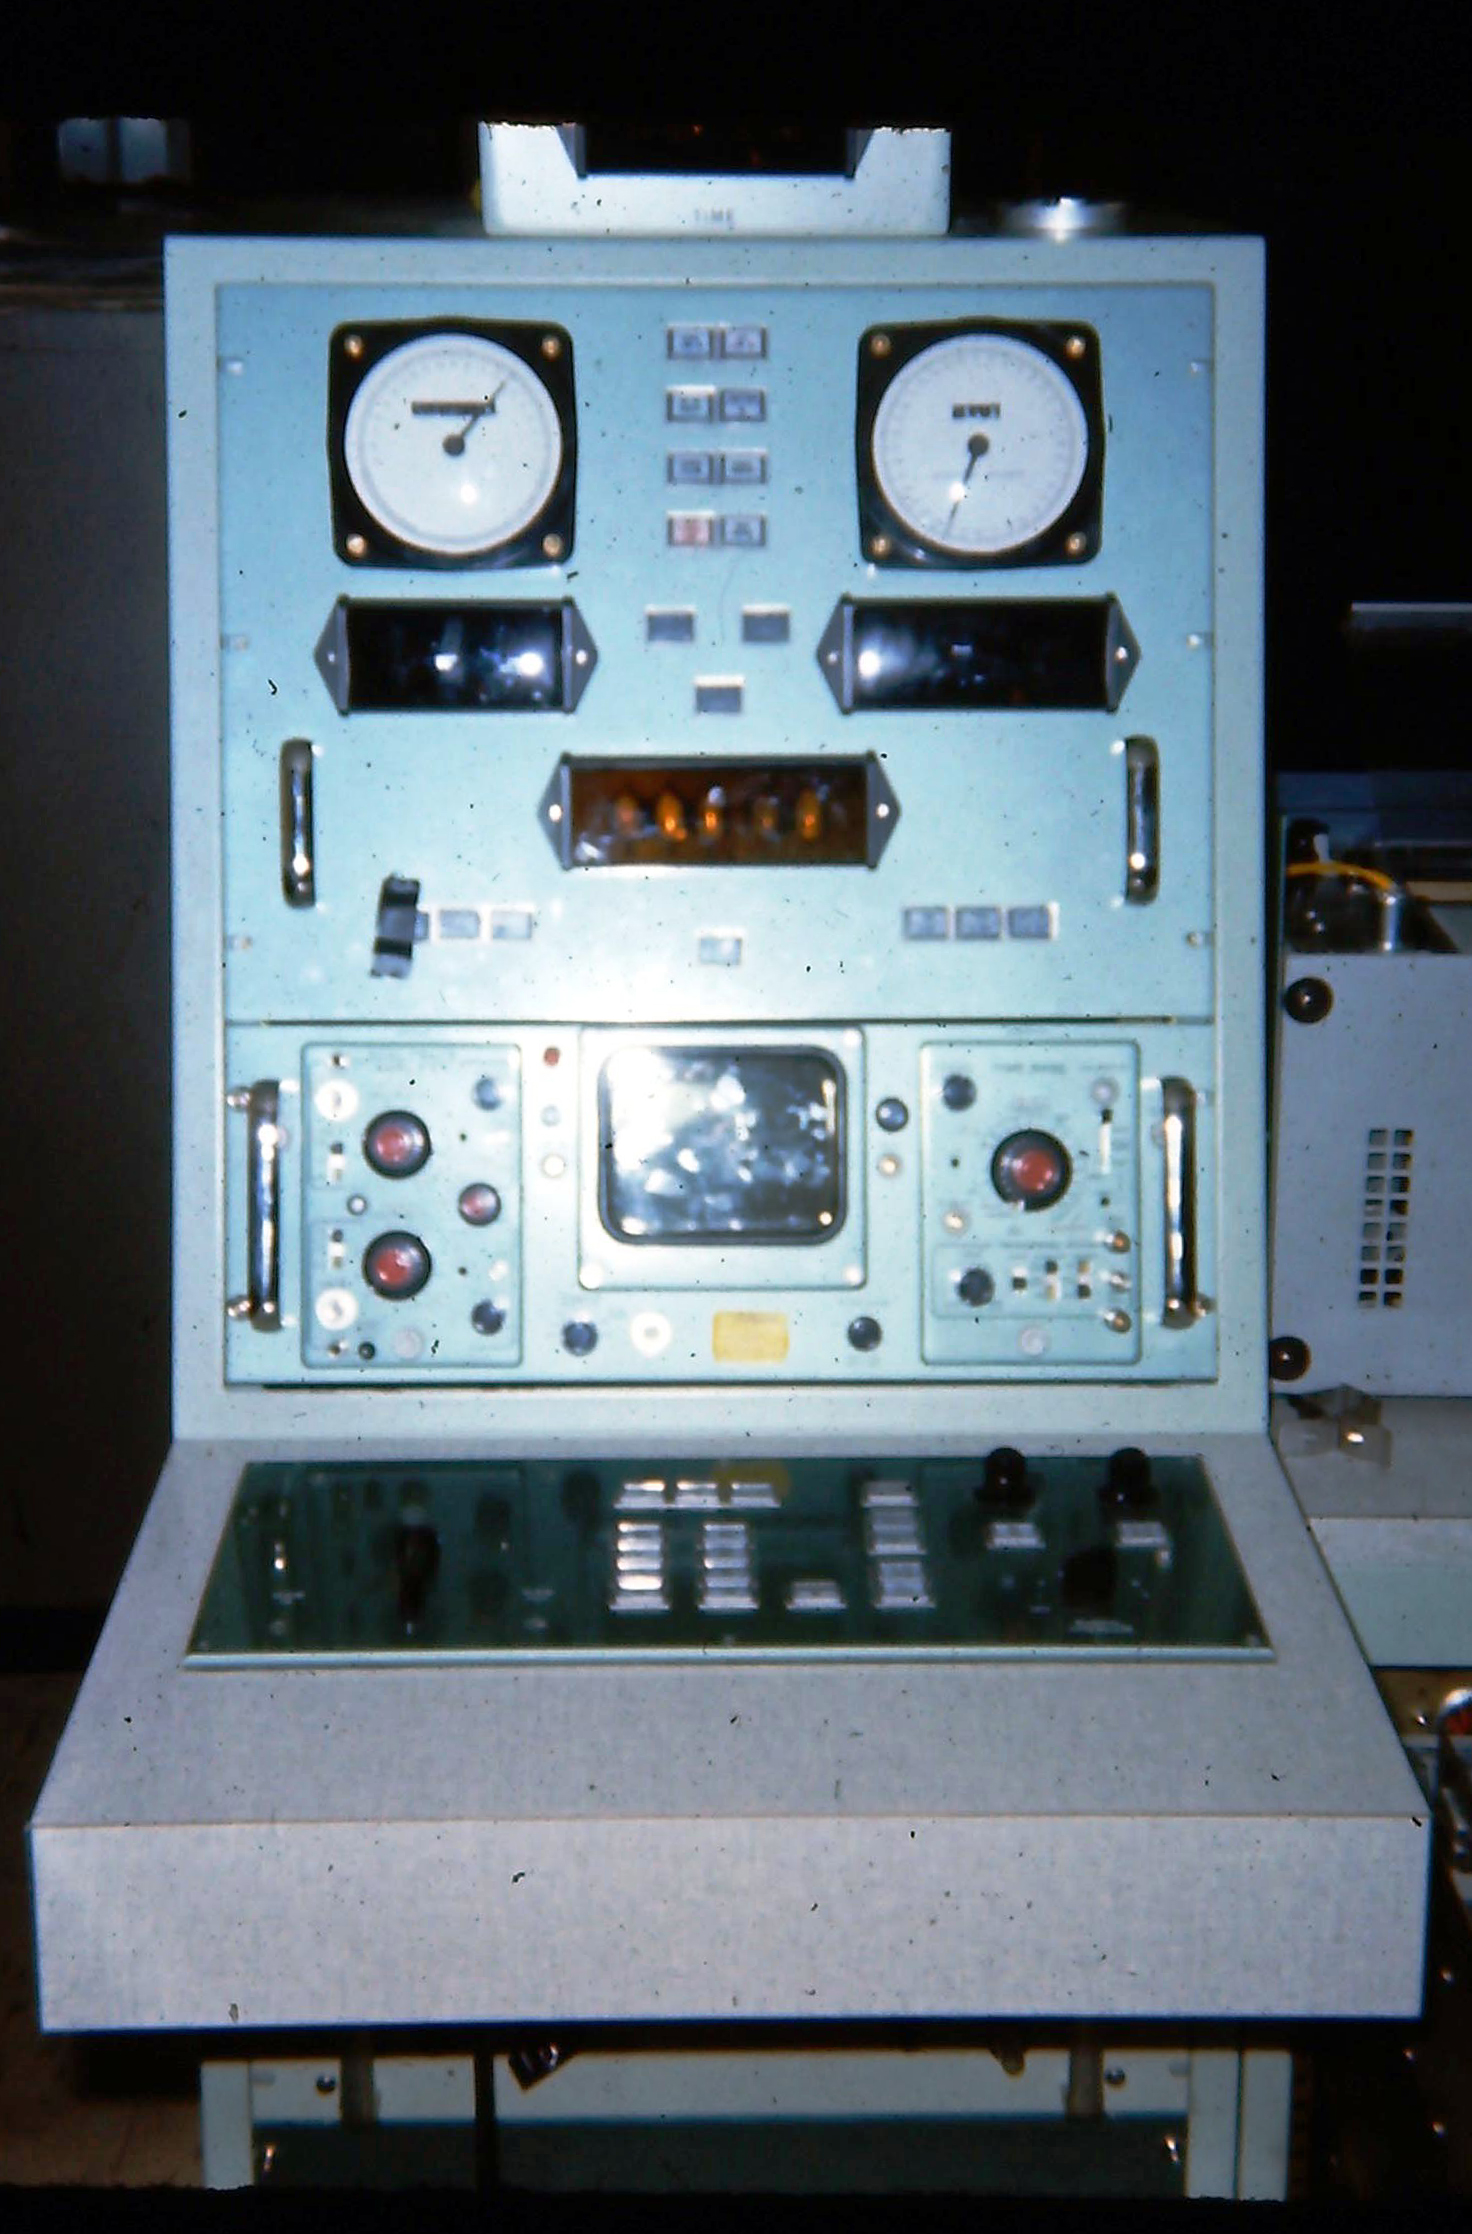 |
| AN/FPQ-10 Control Panel #1. The dual trace
scope on the operator's position provided a standard "A" display on one
line and on the other a "range gate". This is where the operator sat to
acquire the balloon and set the radar into auto-track mode. All functions
of the radar were controlled from this console. The 'A' scope was one of
the standard Tektronix models and It was rack mounted, Control Panels,
designated here as # 1 and #2, worked in conjunction with each other. |
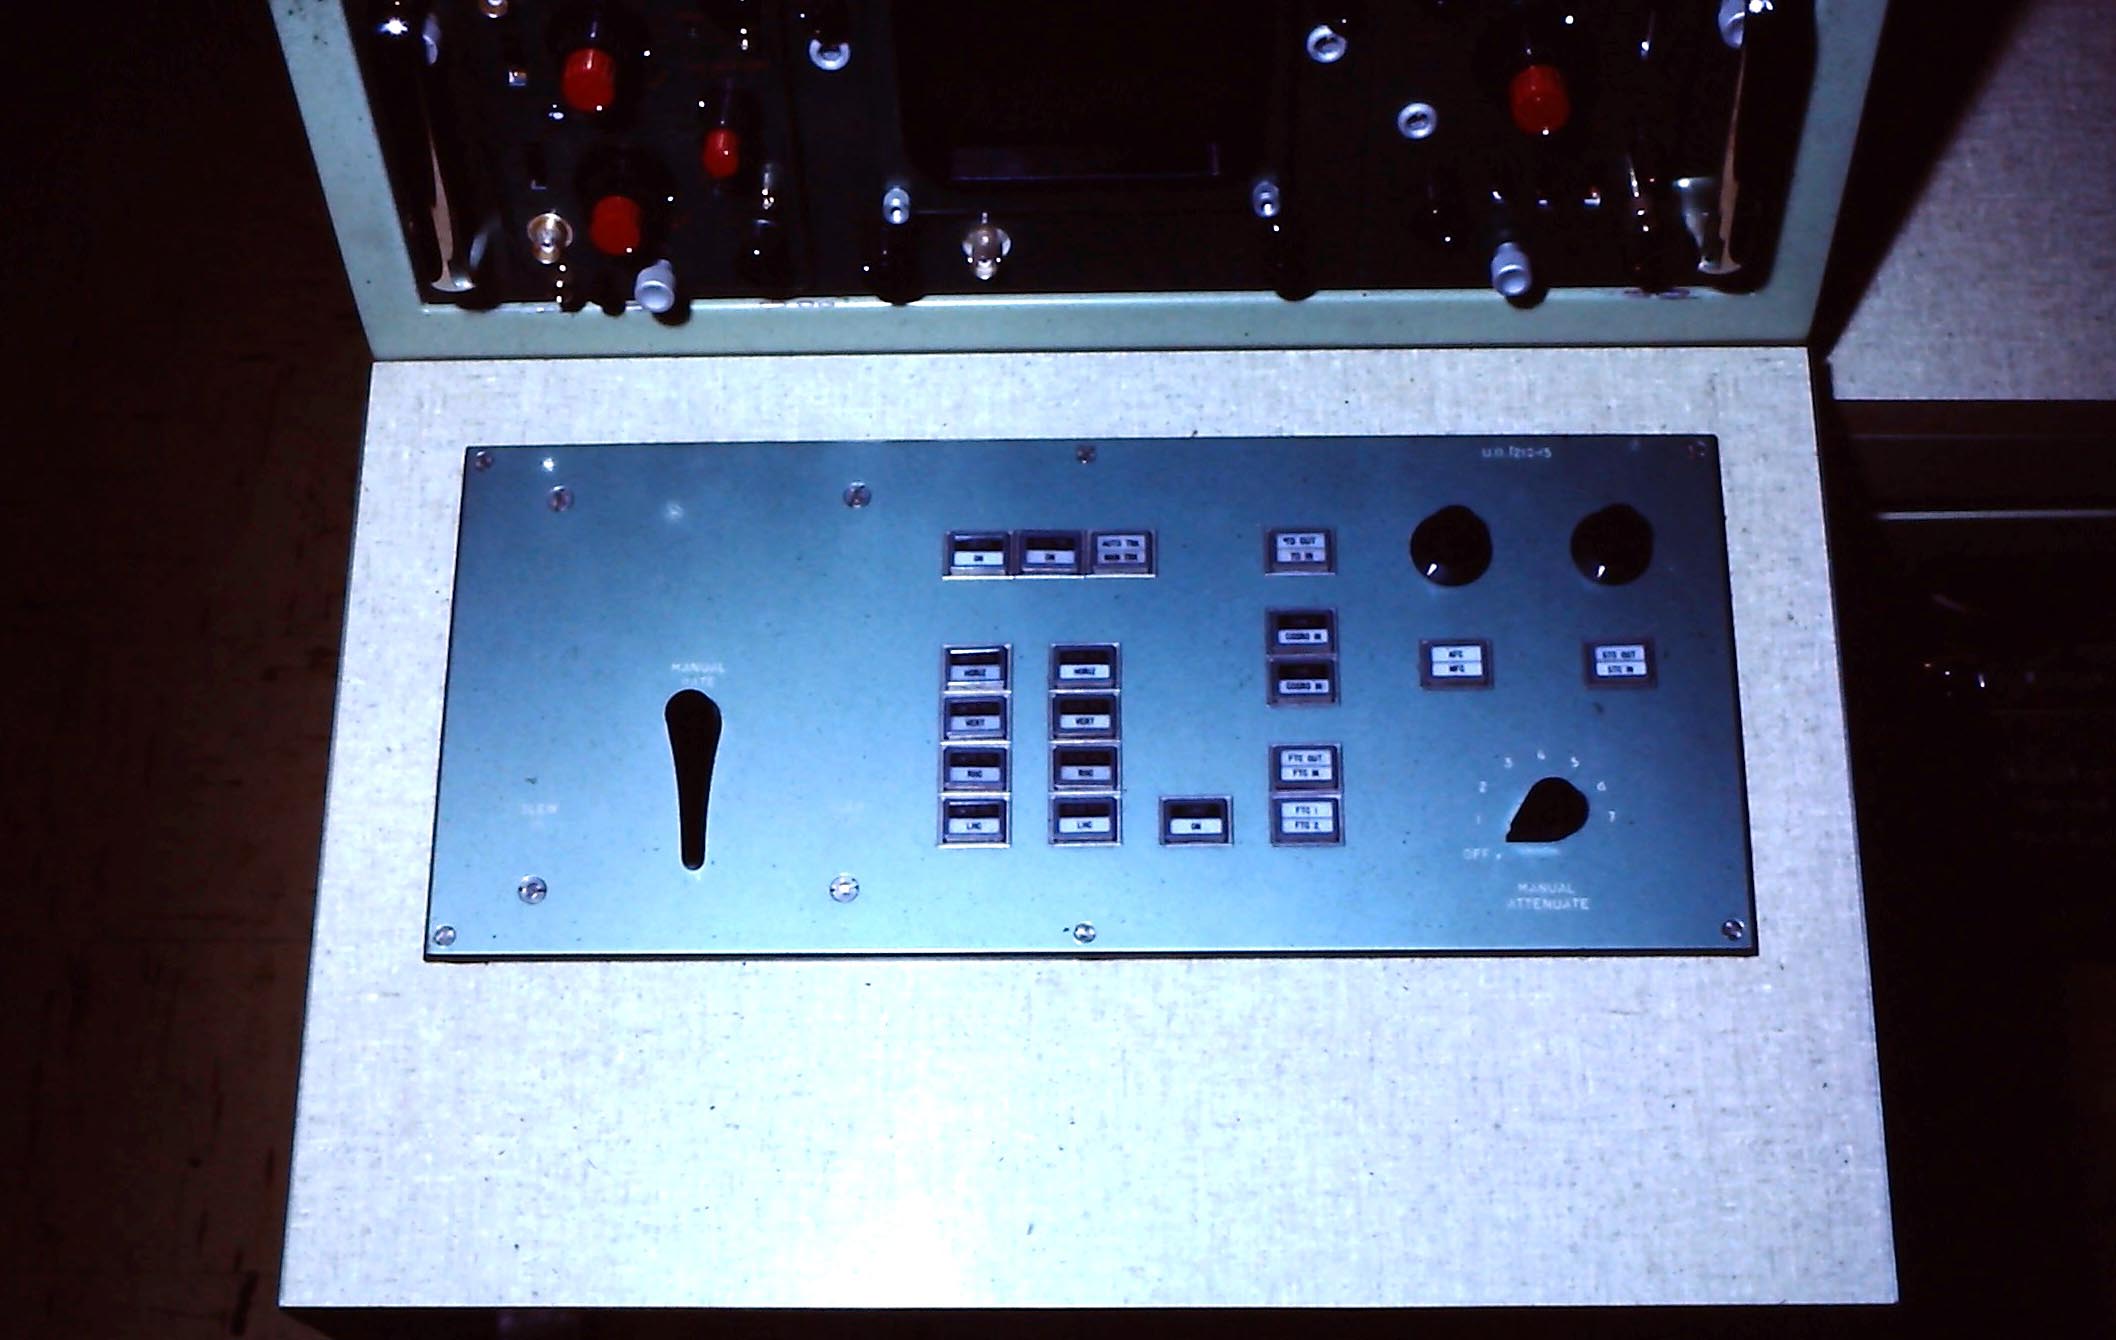 |
| AN/FPQ-10 Control Panel #2. The long vertical
paddle on the left moved the acquisition (from the Ranger) gate out to
the target, both of which would be seen on the scope. The rotary
knob on the lower right inserted some receiver attenuation, as the return
from a close in target would be very strong. One of the buttons controlled
a waveguide shutter to attenuate the receive signal even further. The receiver
had an excellent automatic frequency control, much better than really needed. |
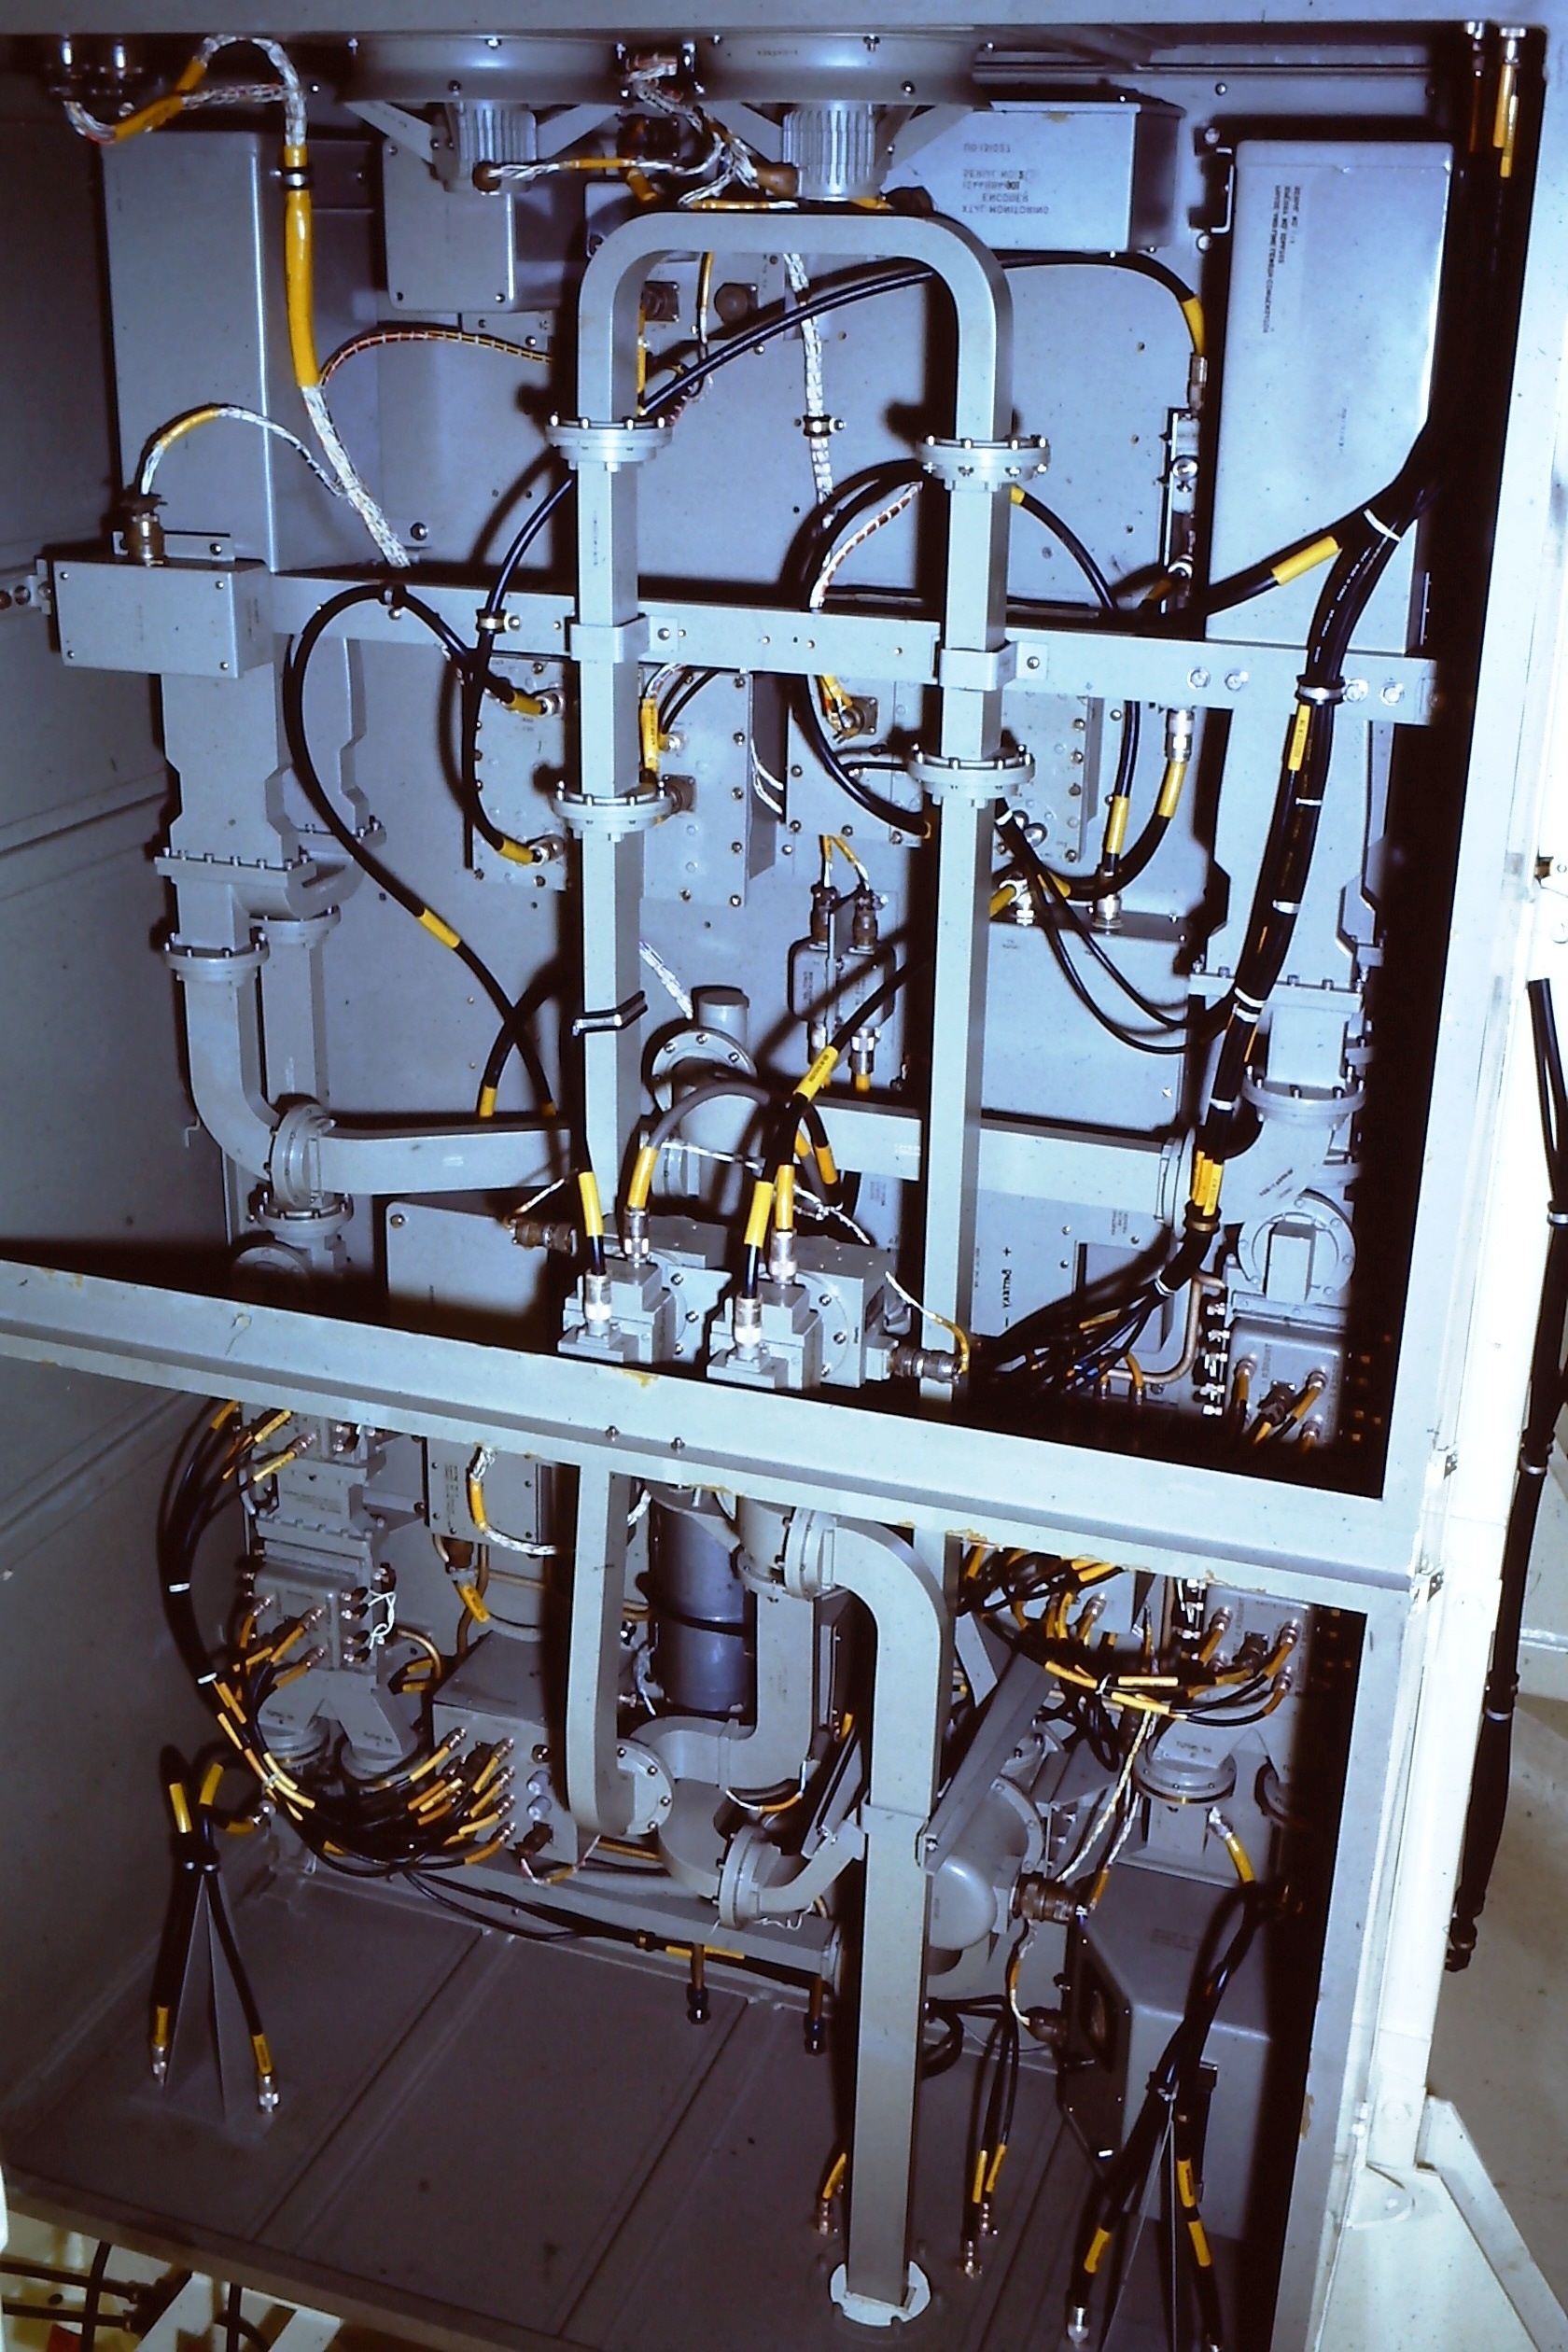 |
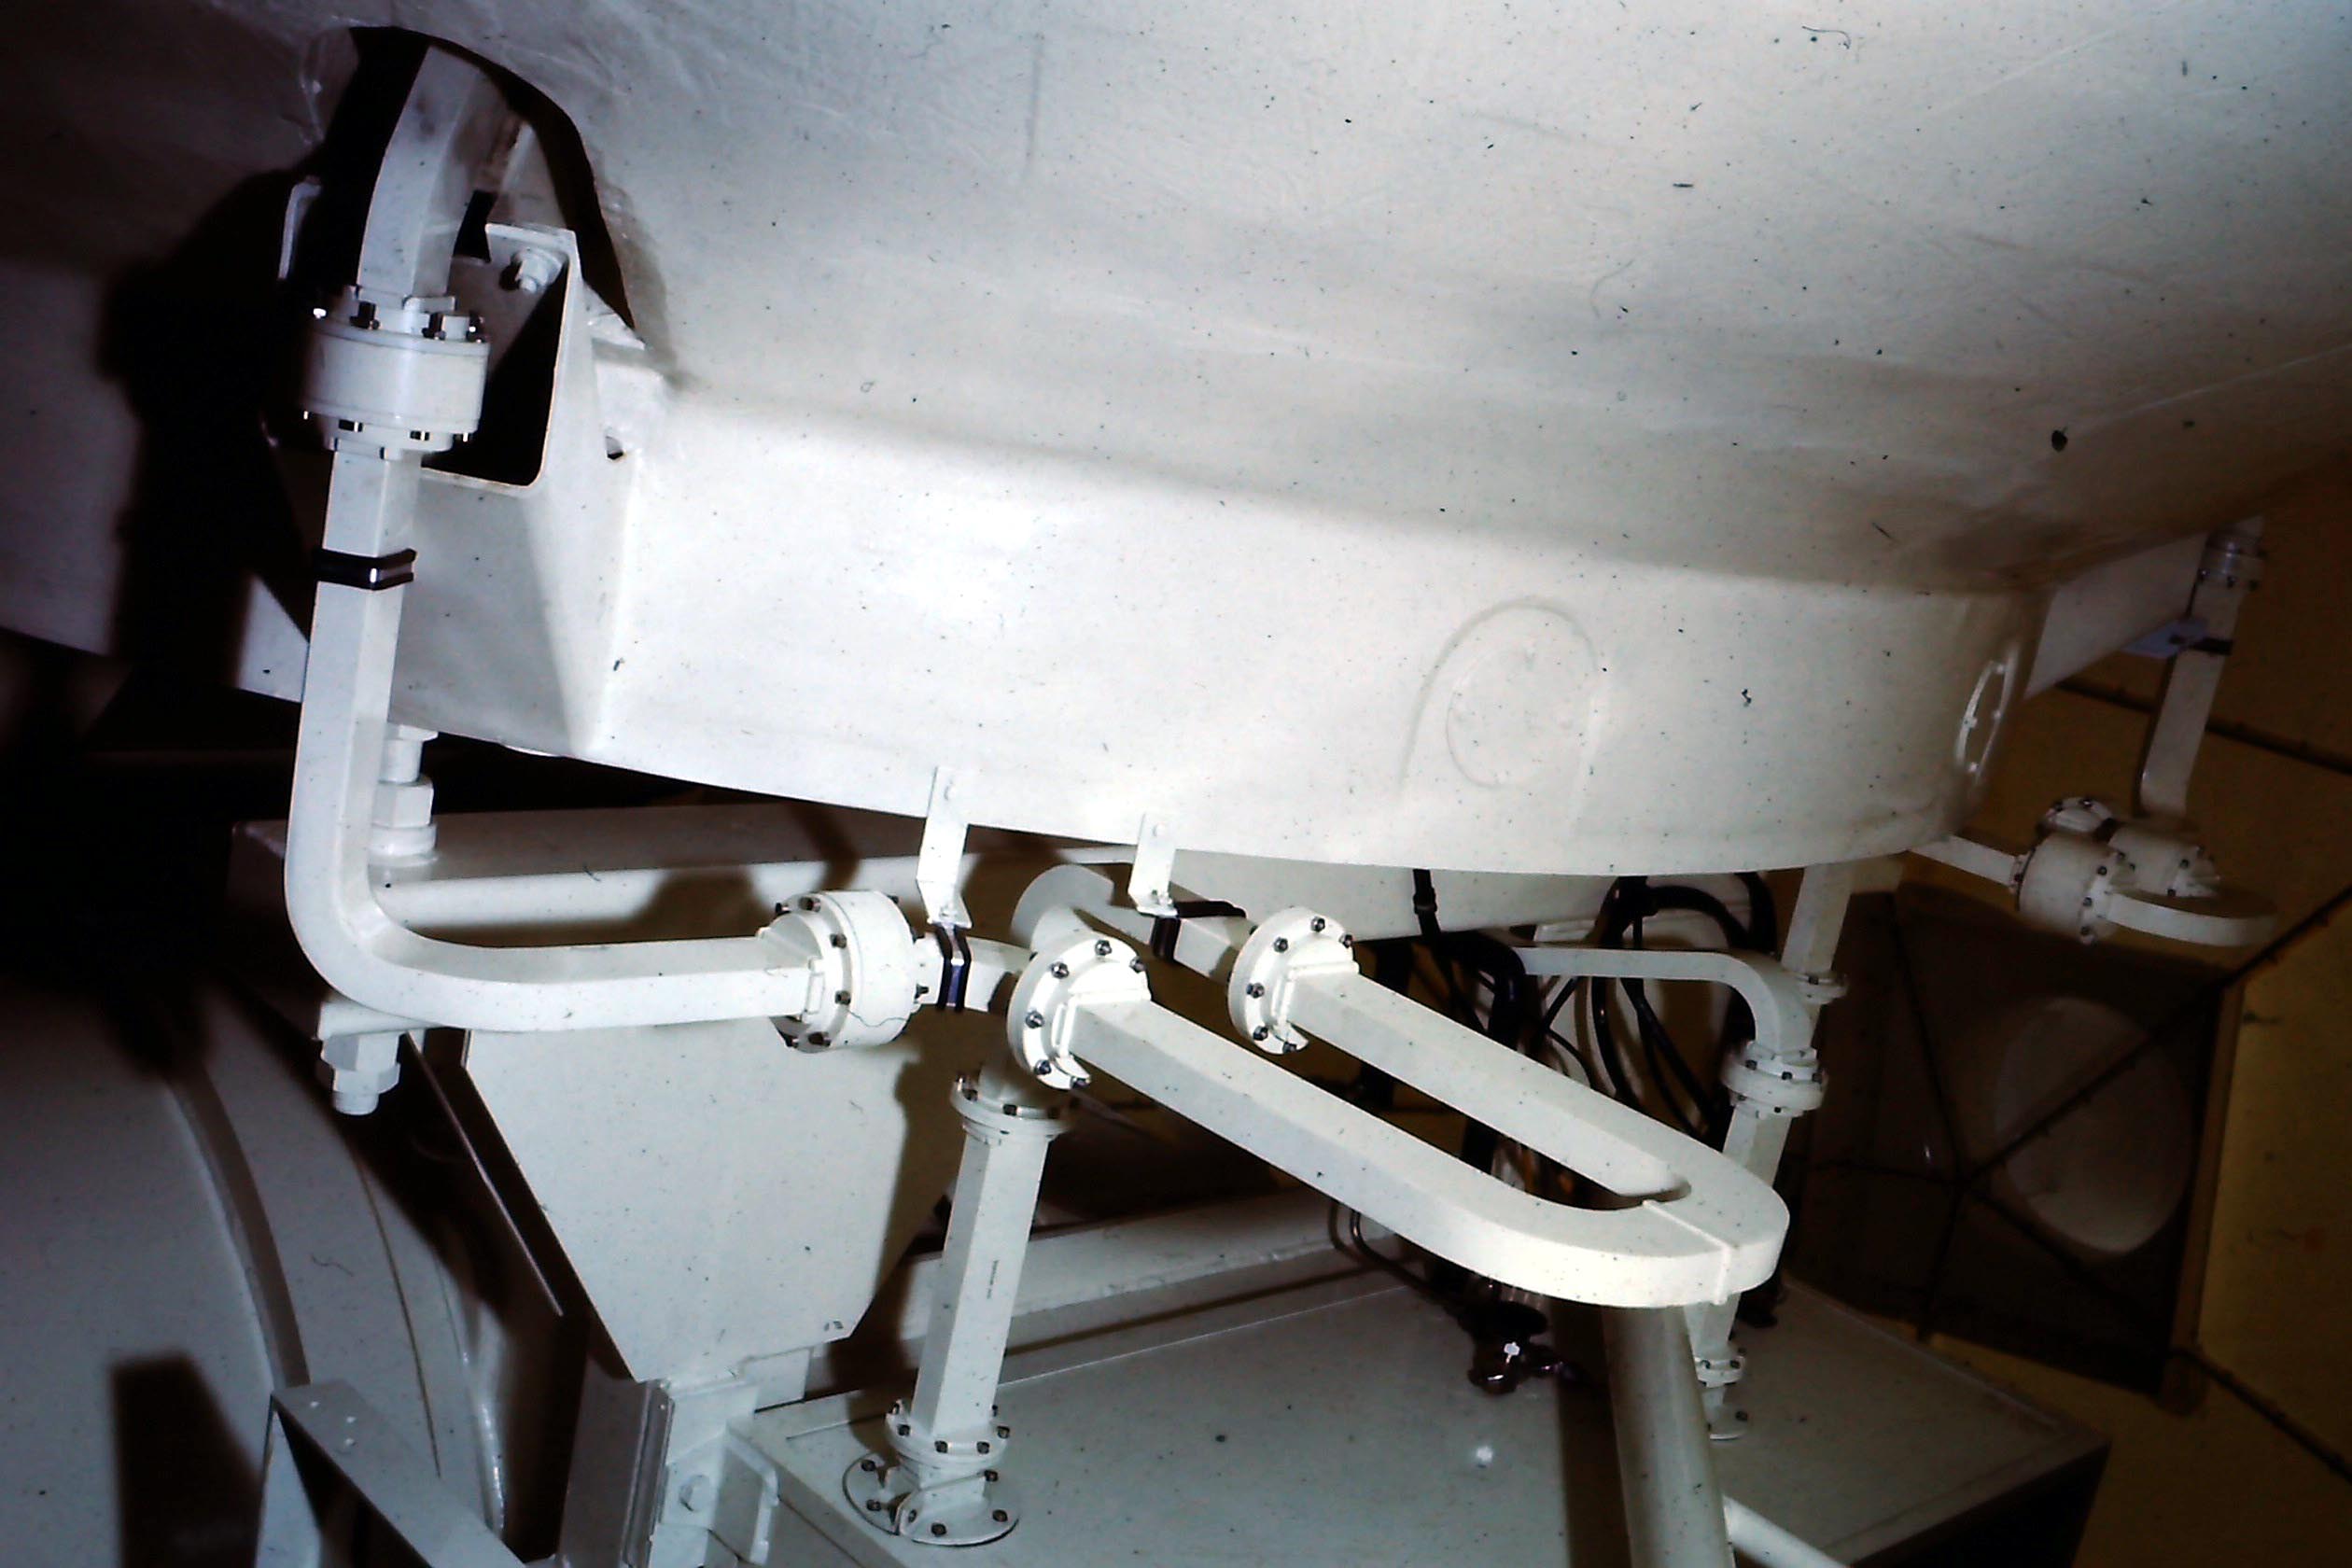
| AN/FPQ-10 This waveguide matrix is cool
but why so much of it ? |
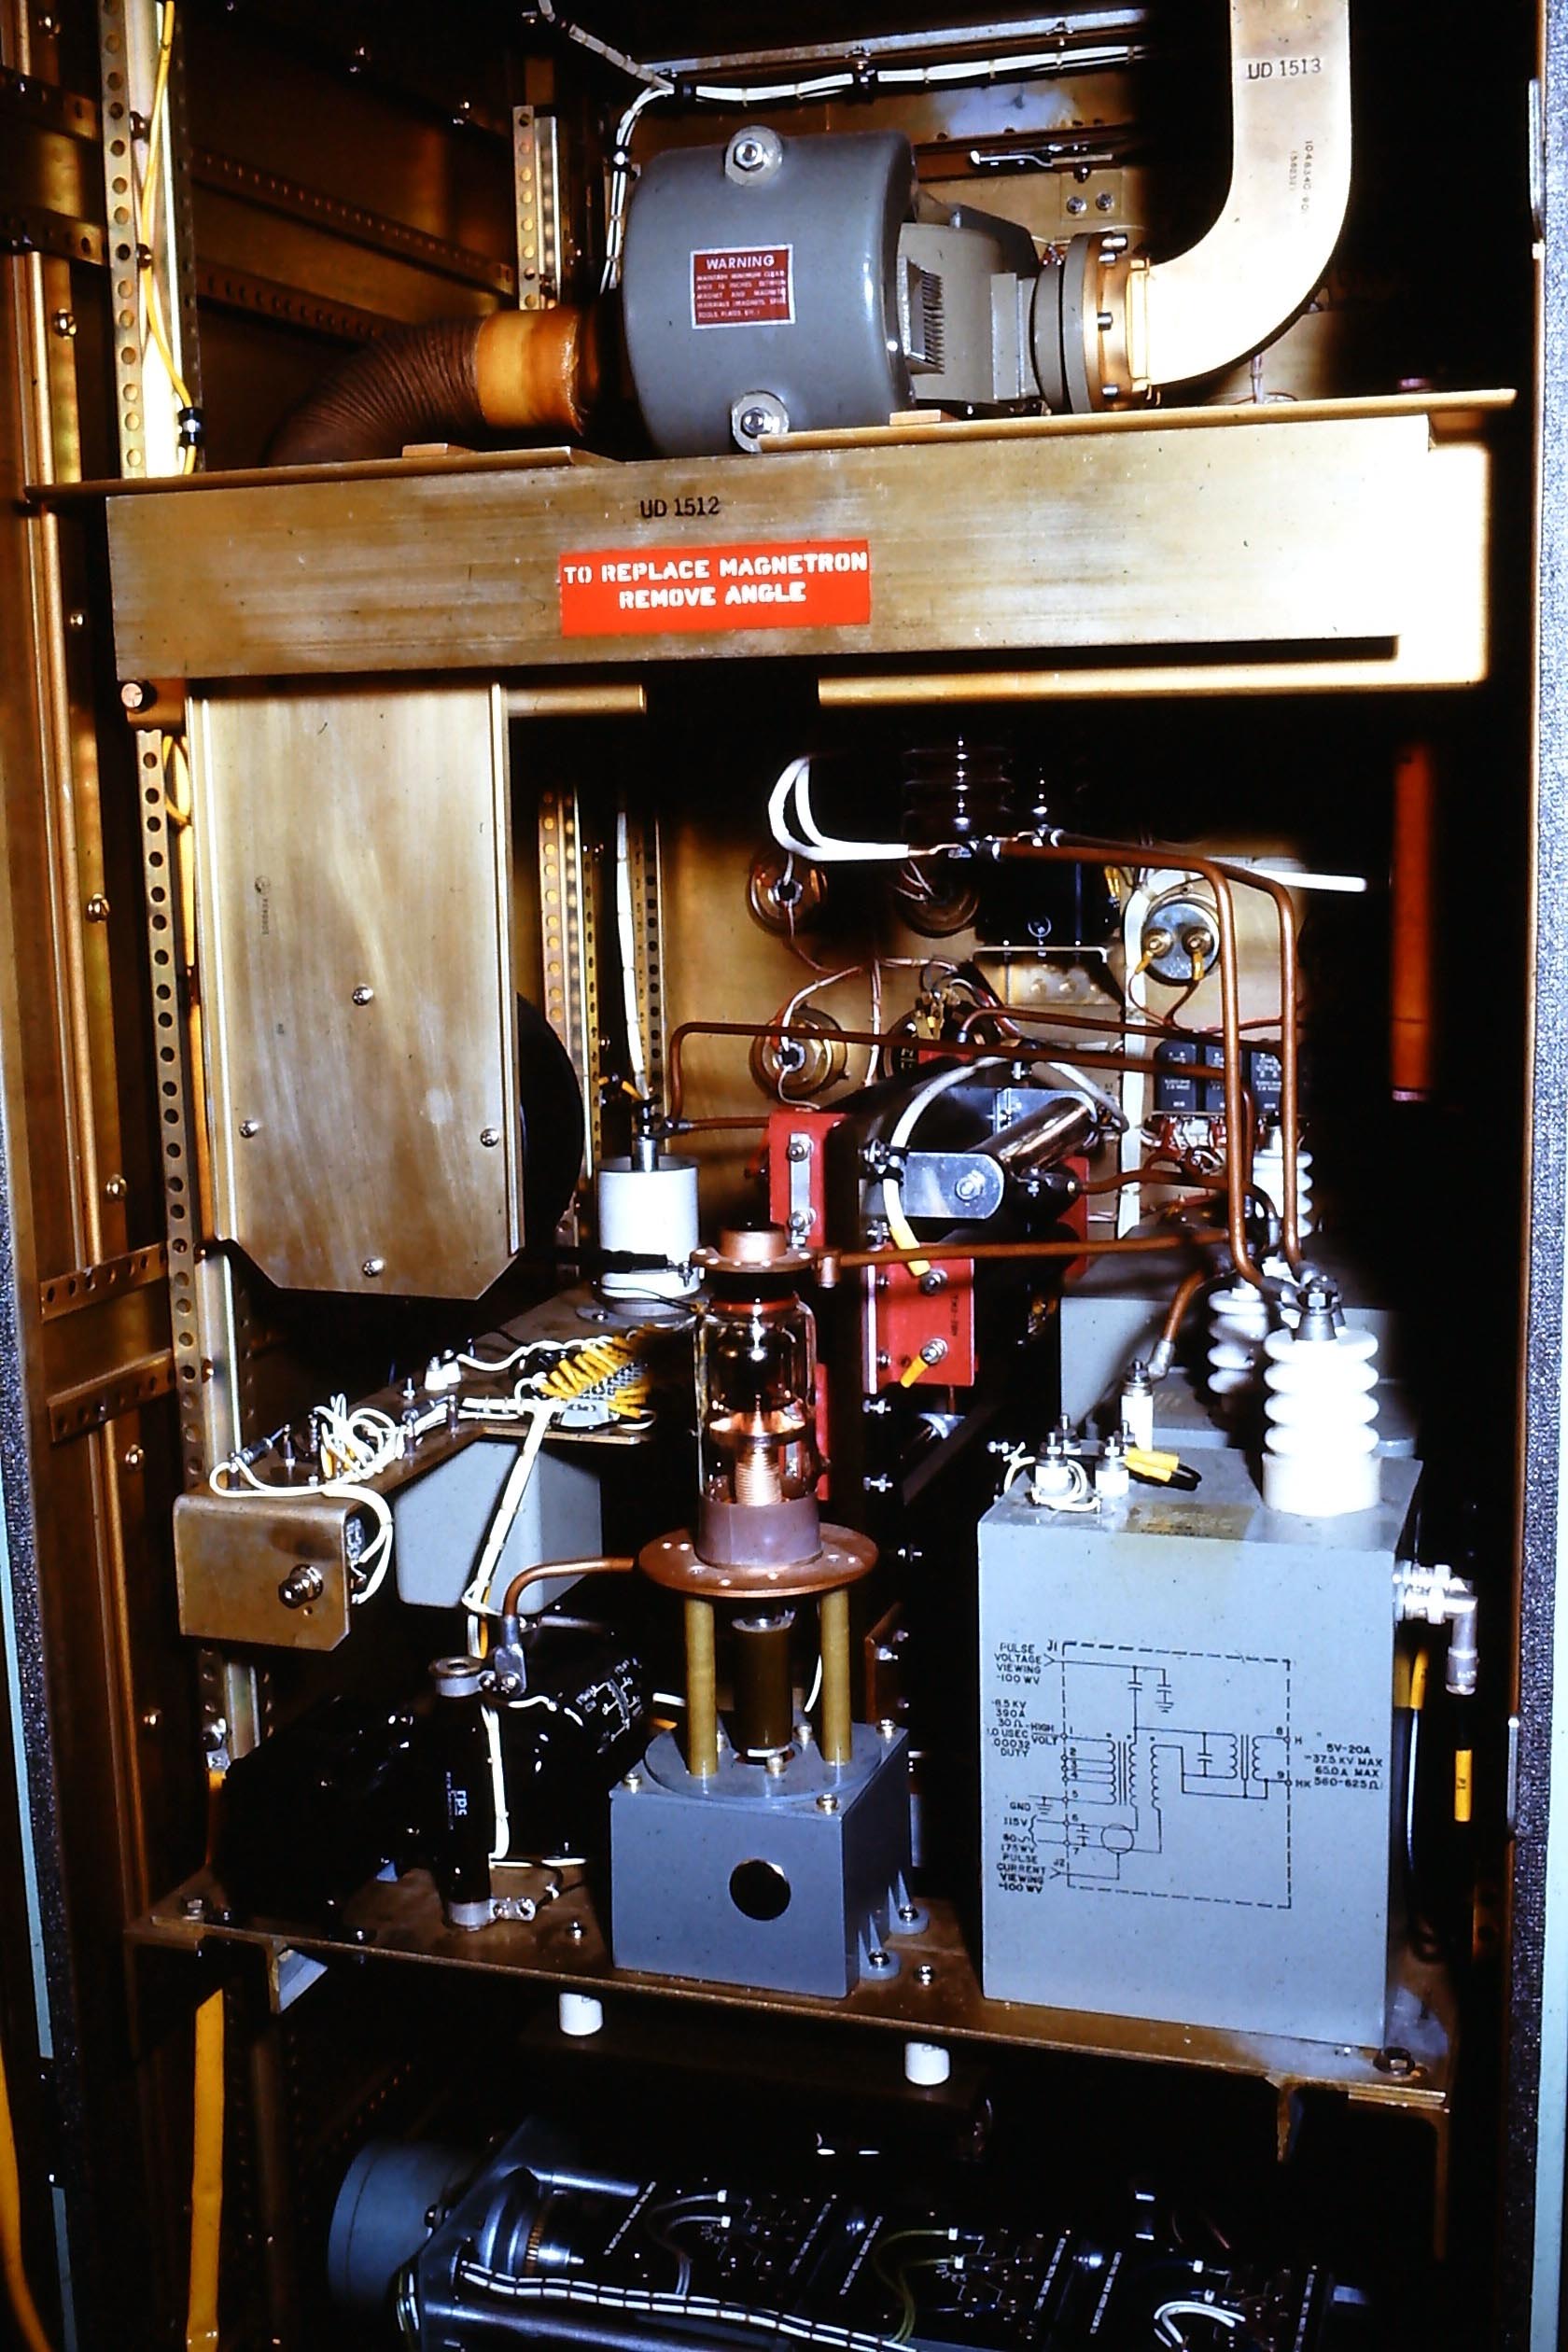 |
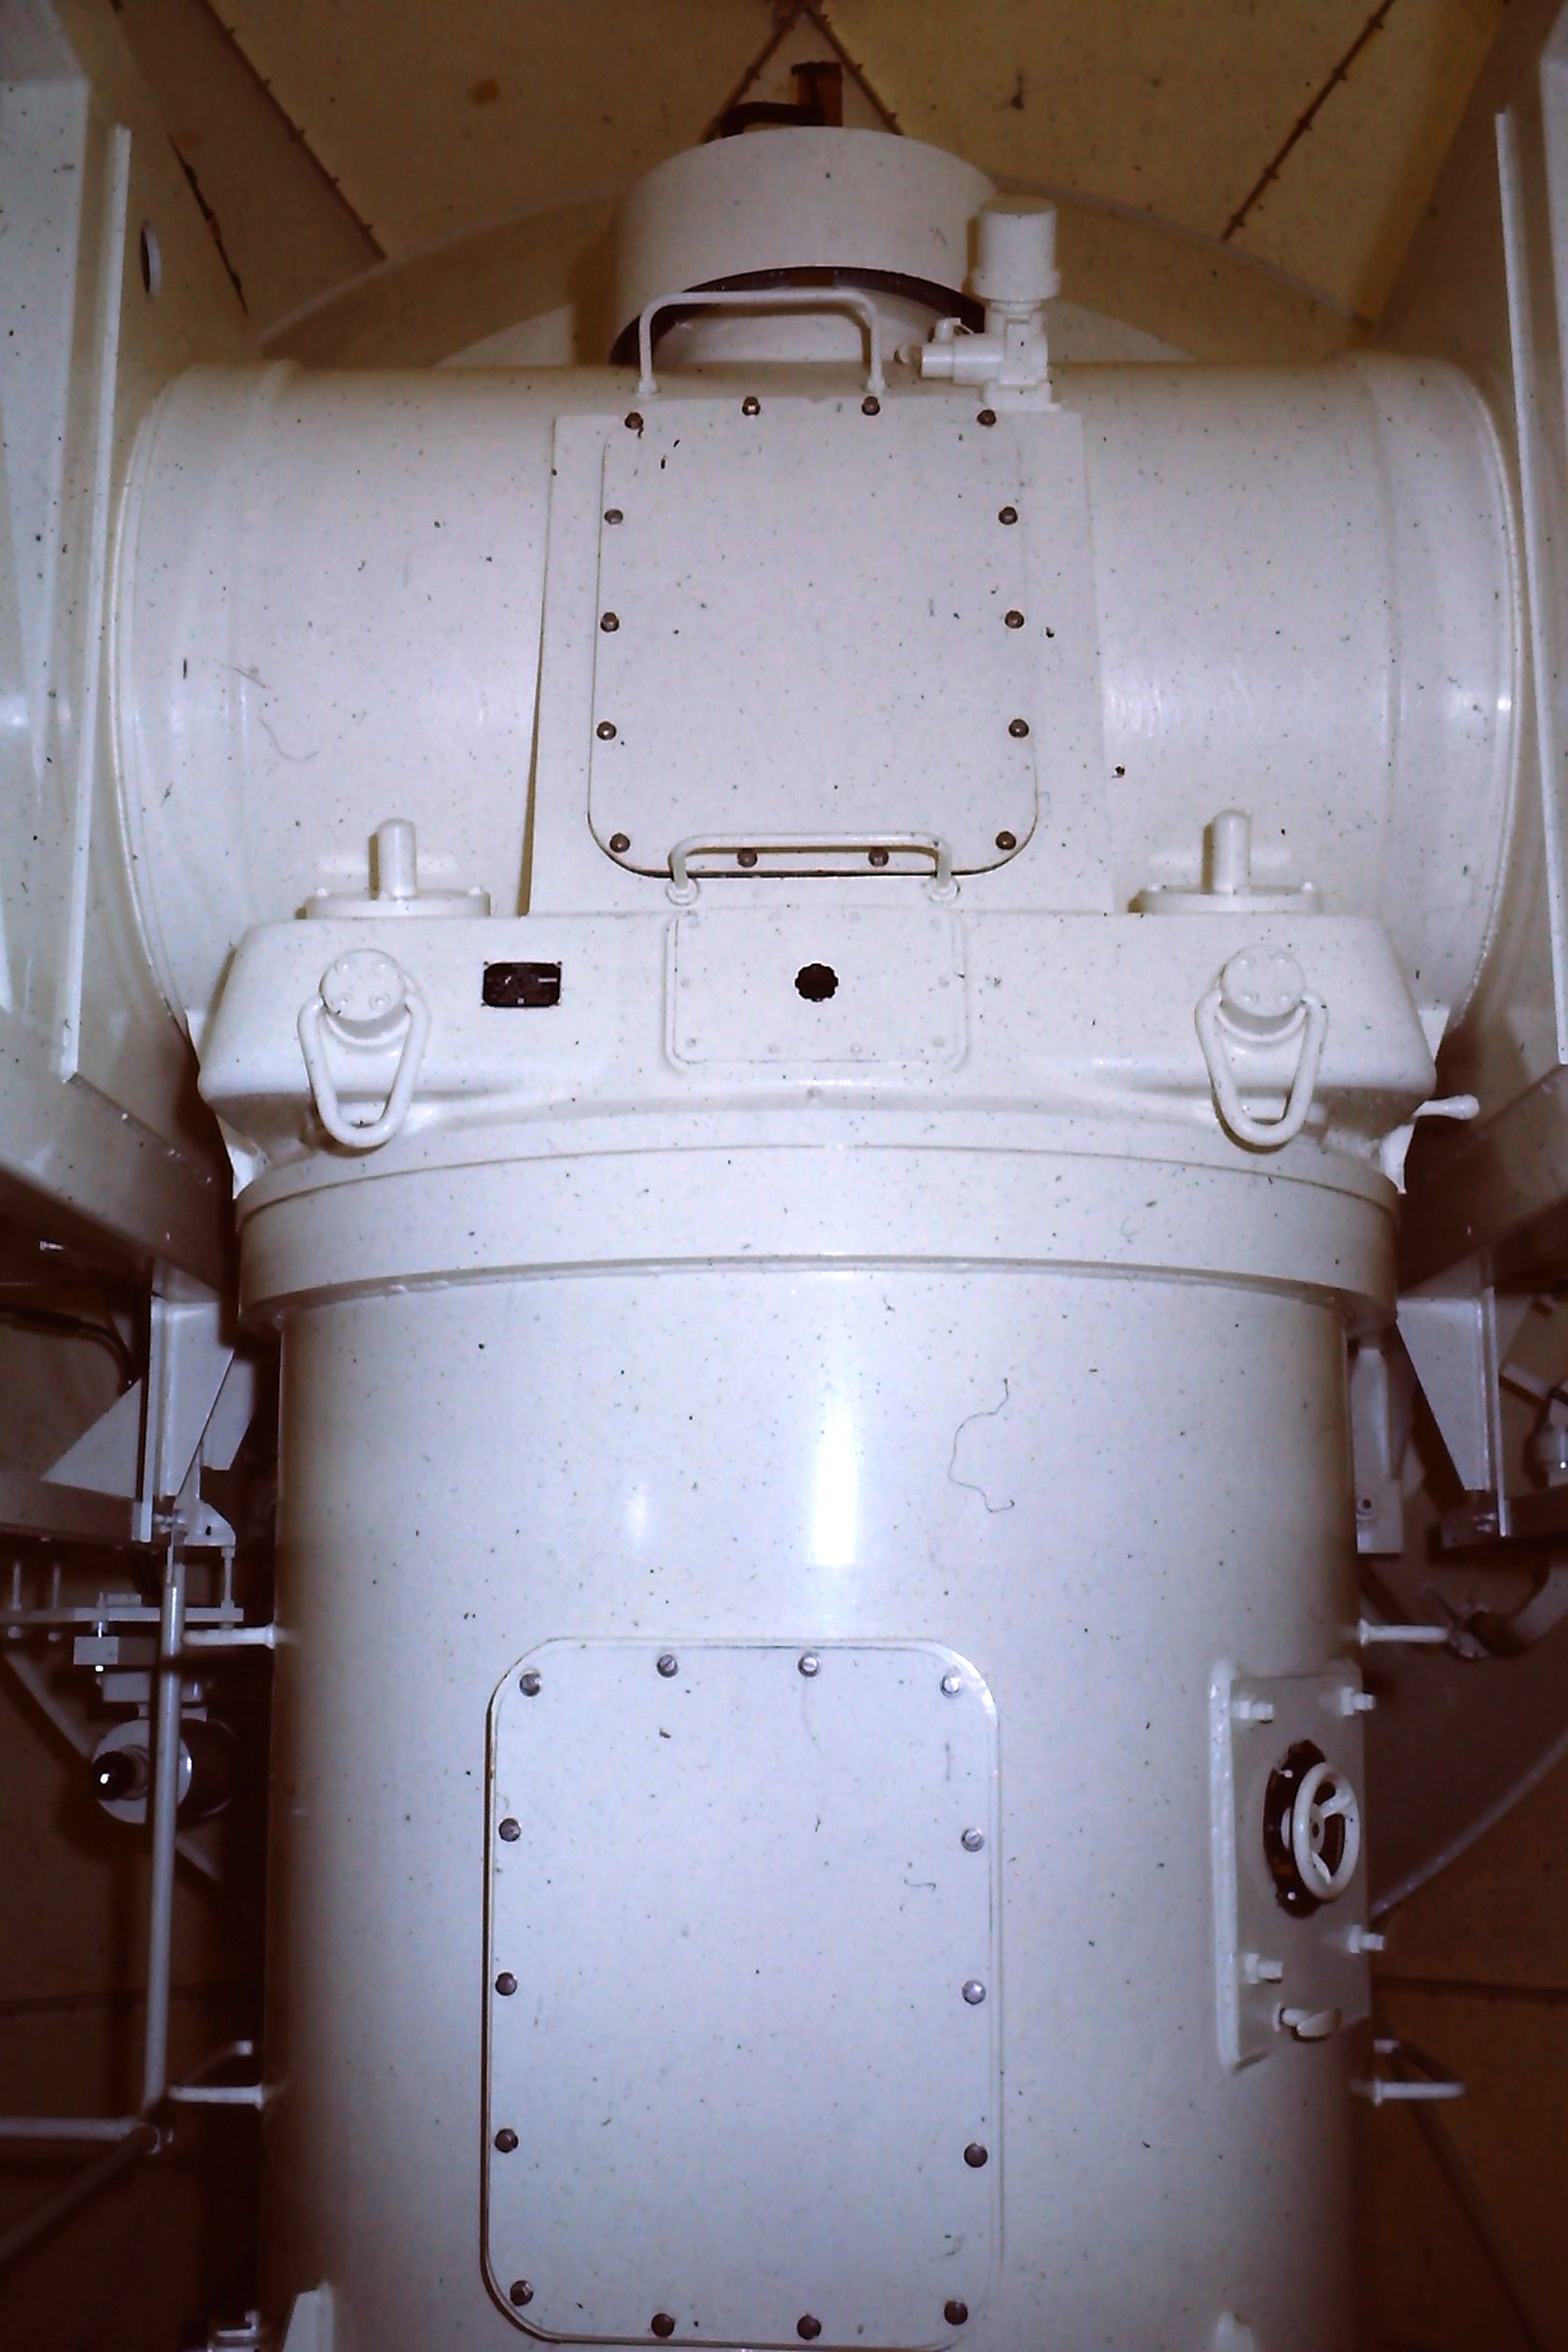
| AN/FPQ-10 transmitter. The magnetron is
located at the top center of this photograph. |
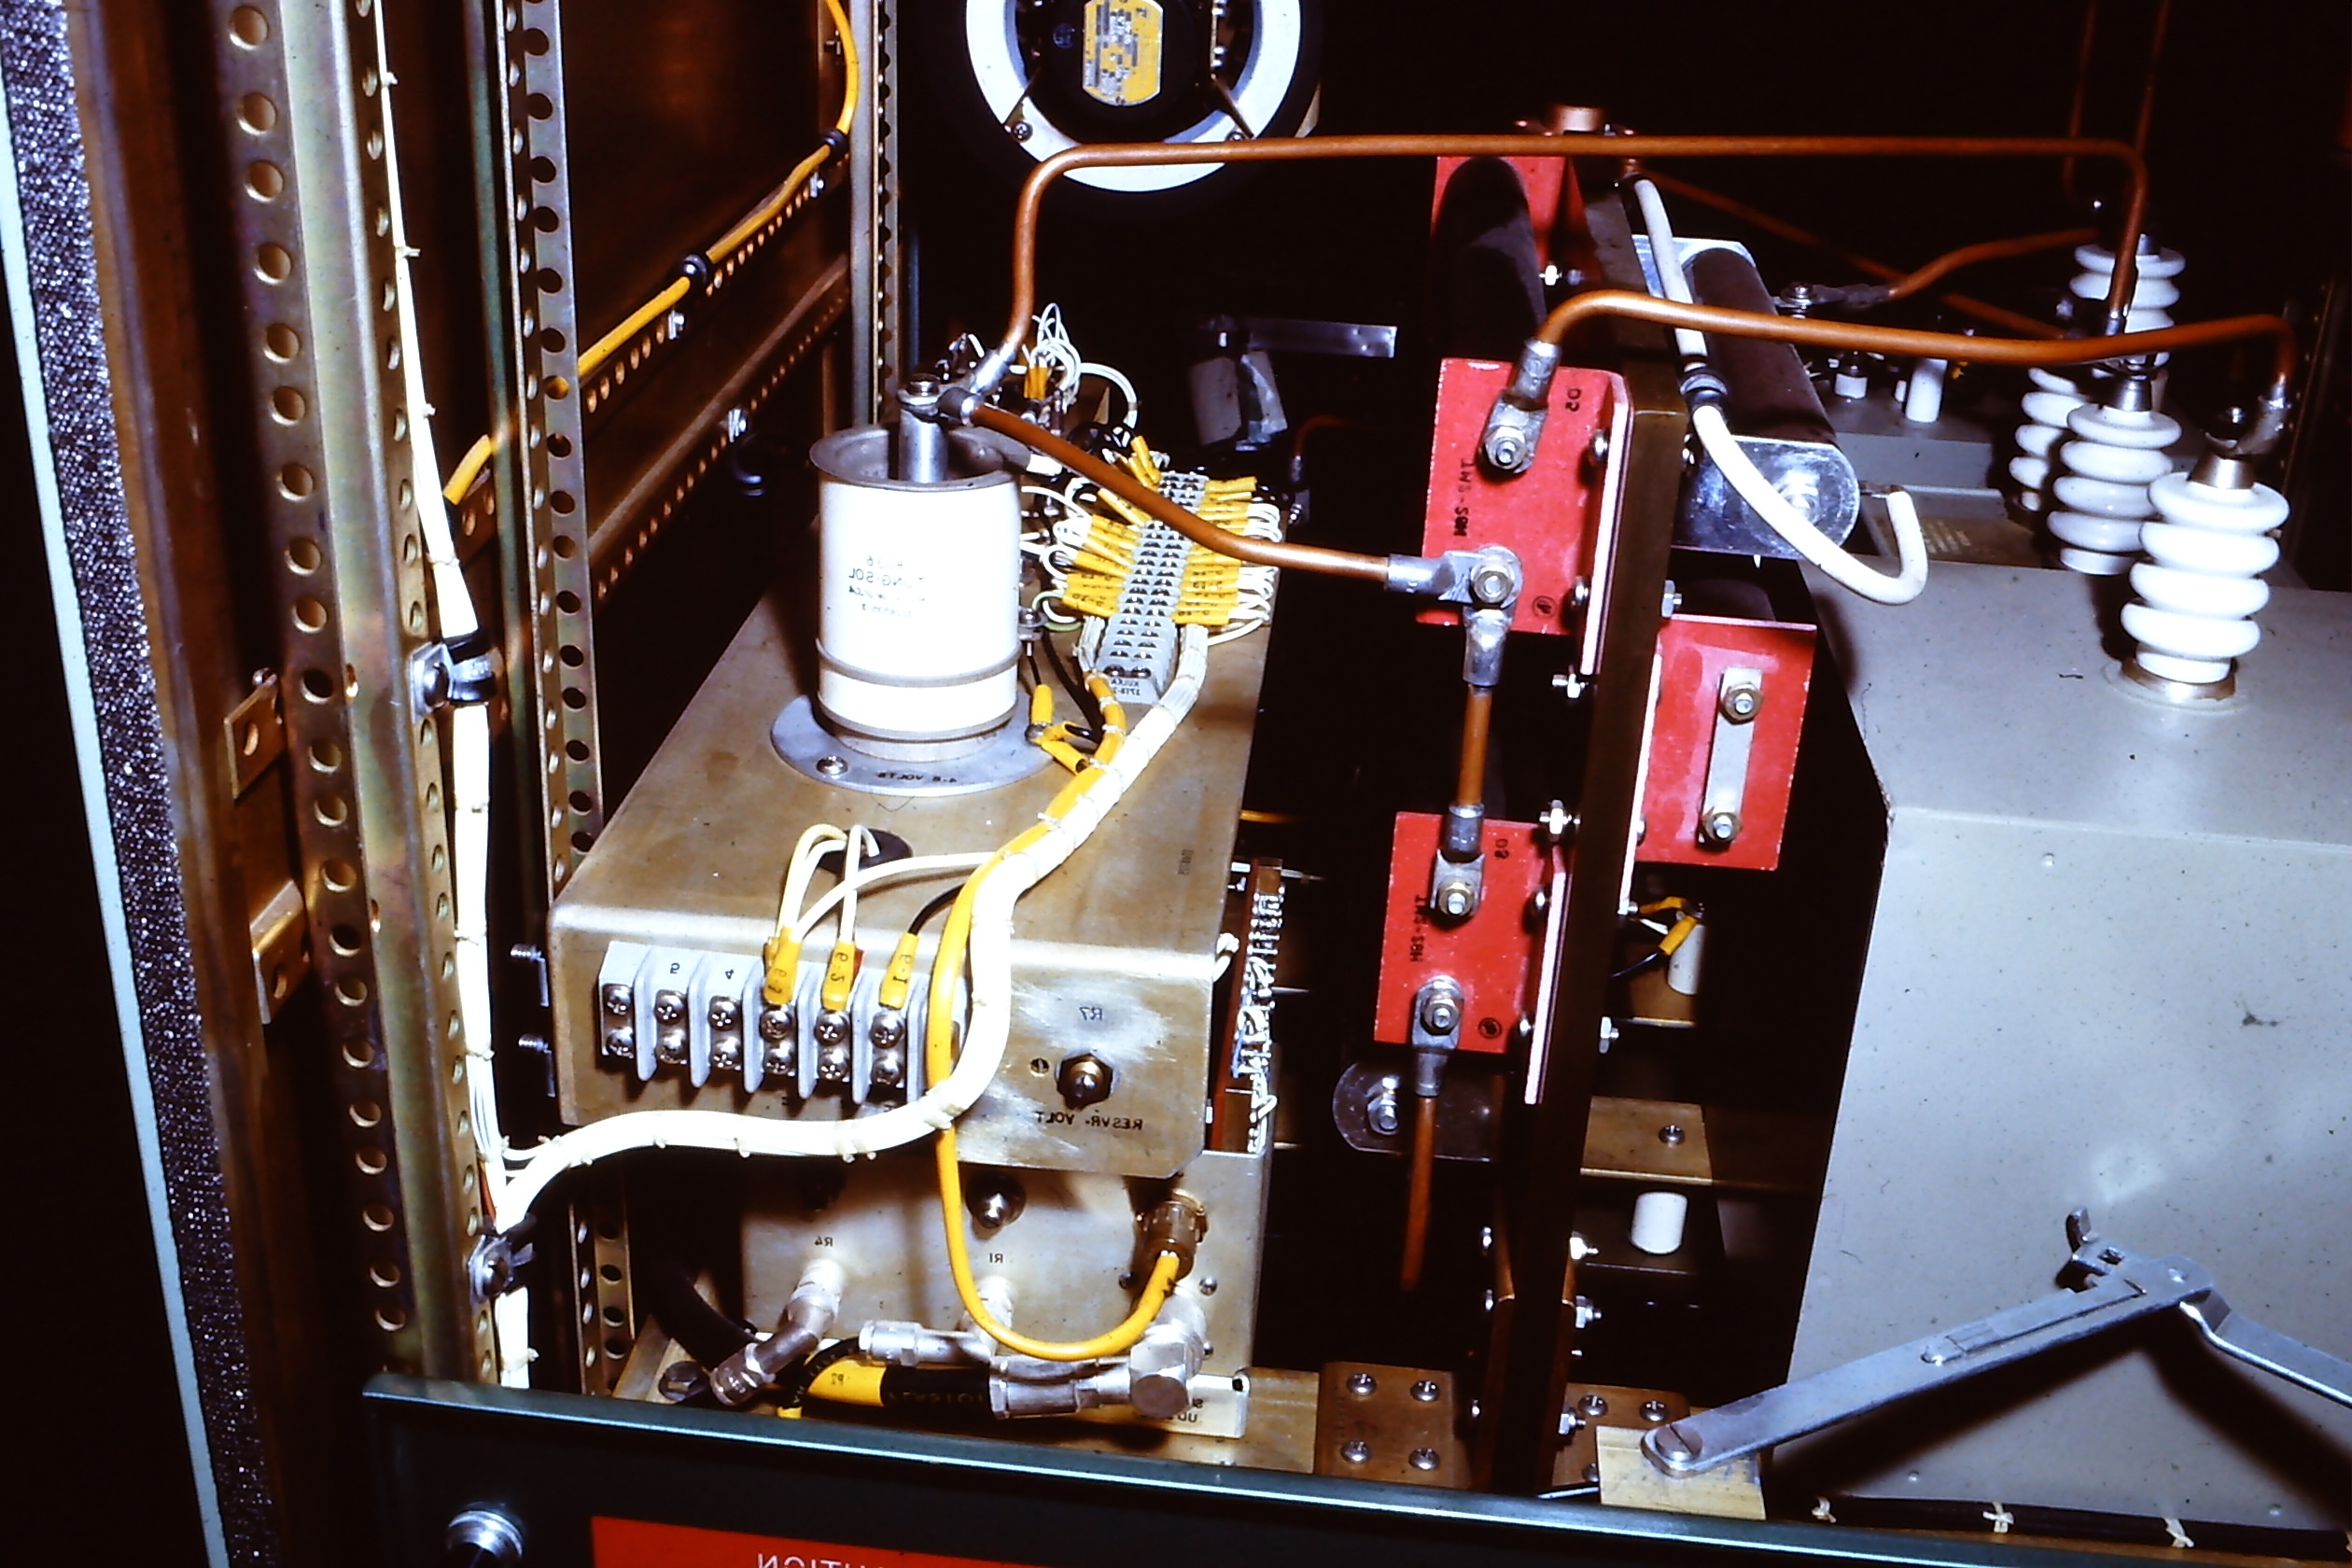 |
| AN/FPQ-10 modulator stage in the transmitter.
The modulator contains an energy-storing device which accumulates energy
during the interval between transmitted pulses. When the modulator is triggered
by a timing pulse, it delivers the stored energy to the transmitter tube
(magnetron) in a short pulse of high power.. |
| All photos in this table by Frank Statham |
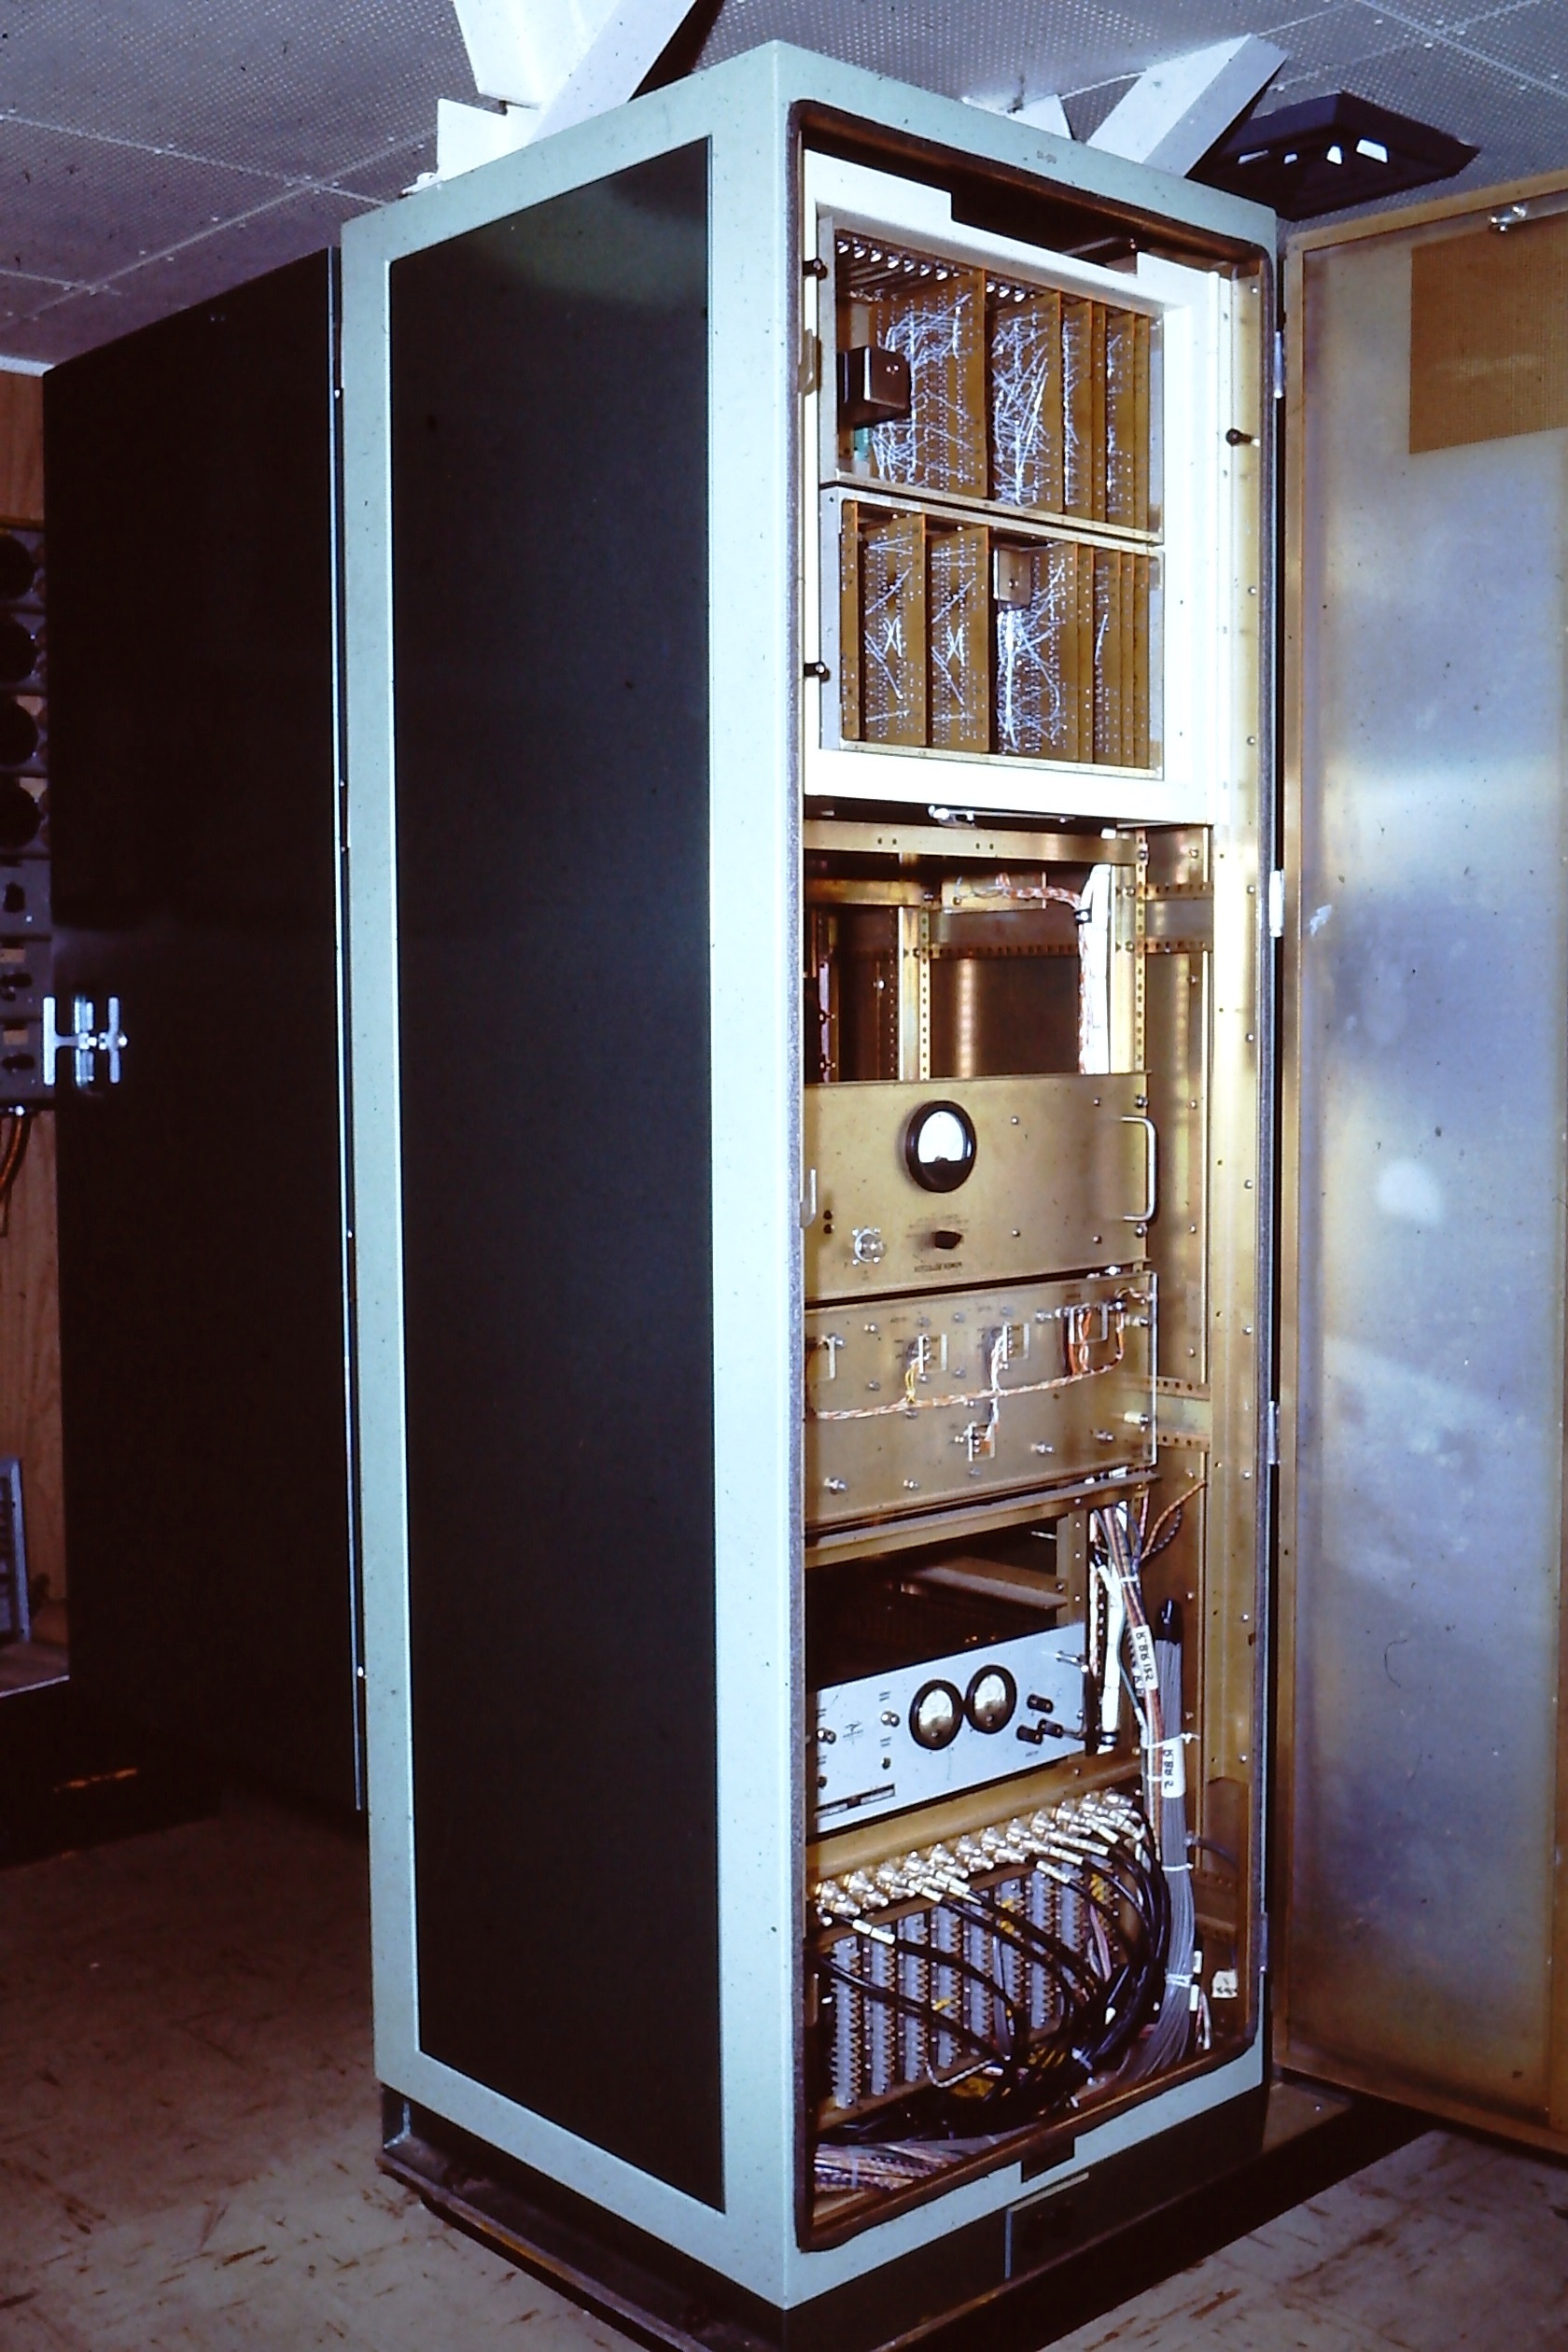 |
| AN/FPQ-10 ranger cabinet The ranger cabinet
did some of the target tracking. |
 |
| AN/FPQ-10 receiver cabinet |
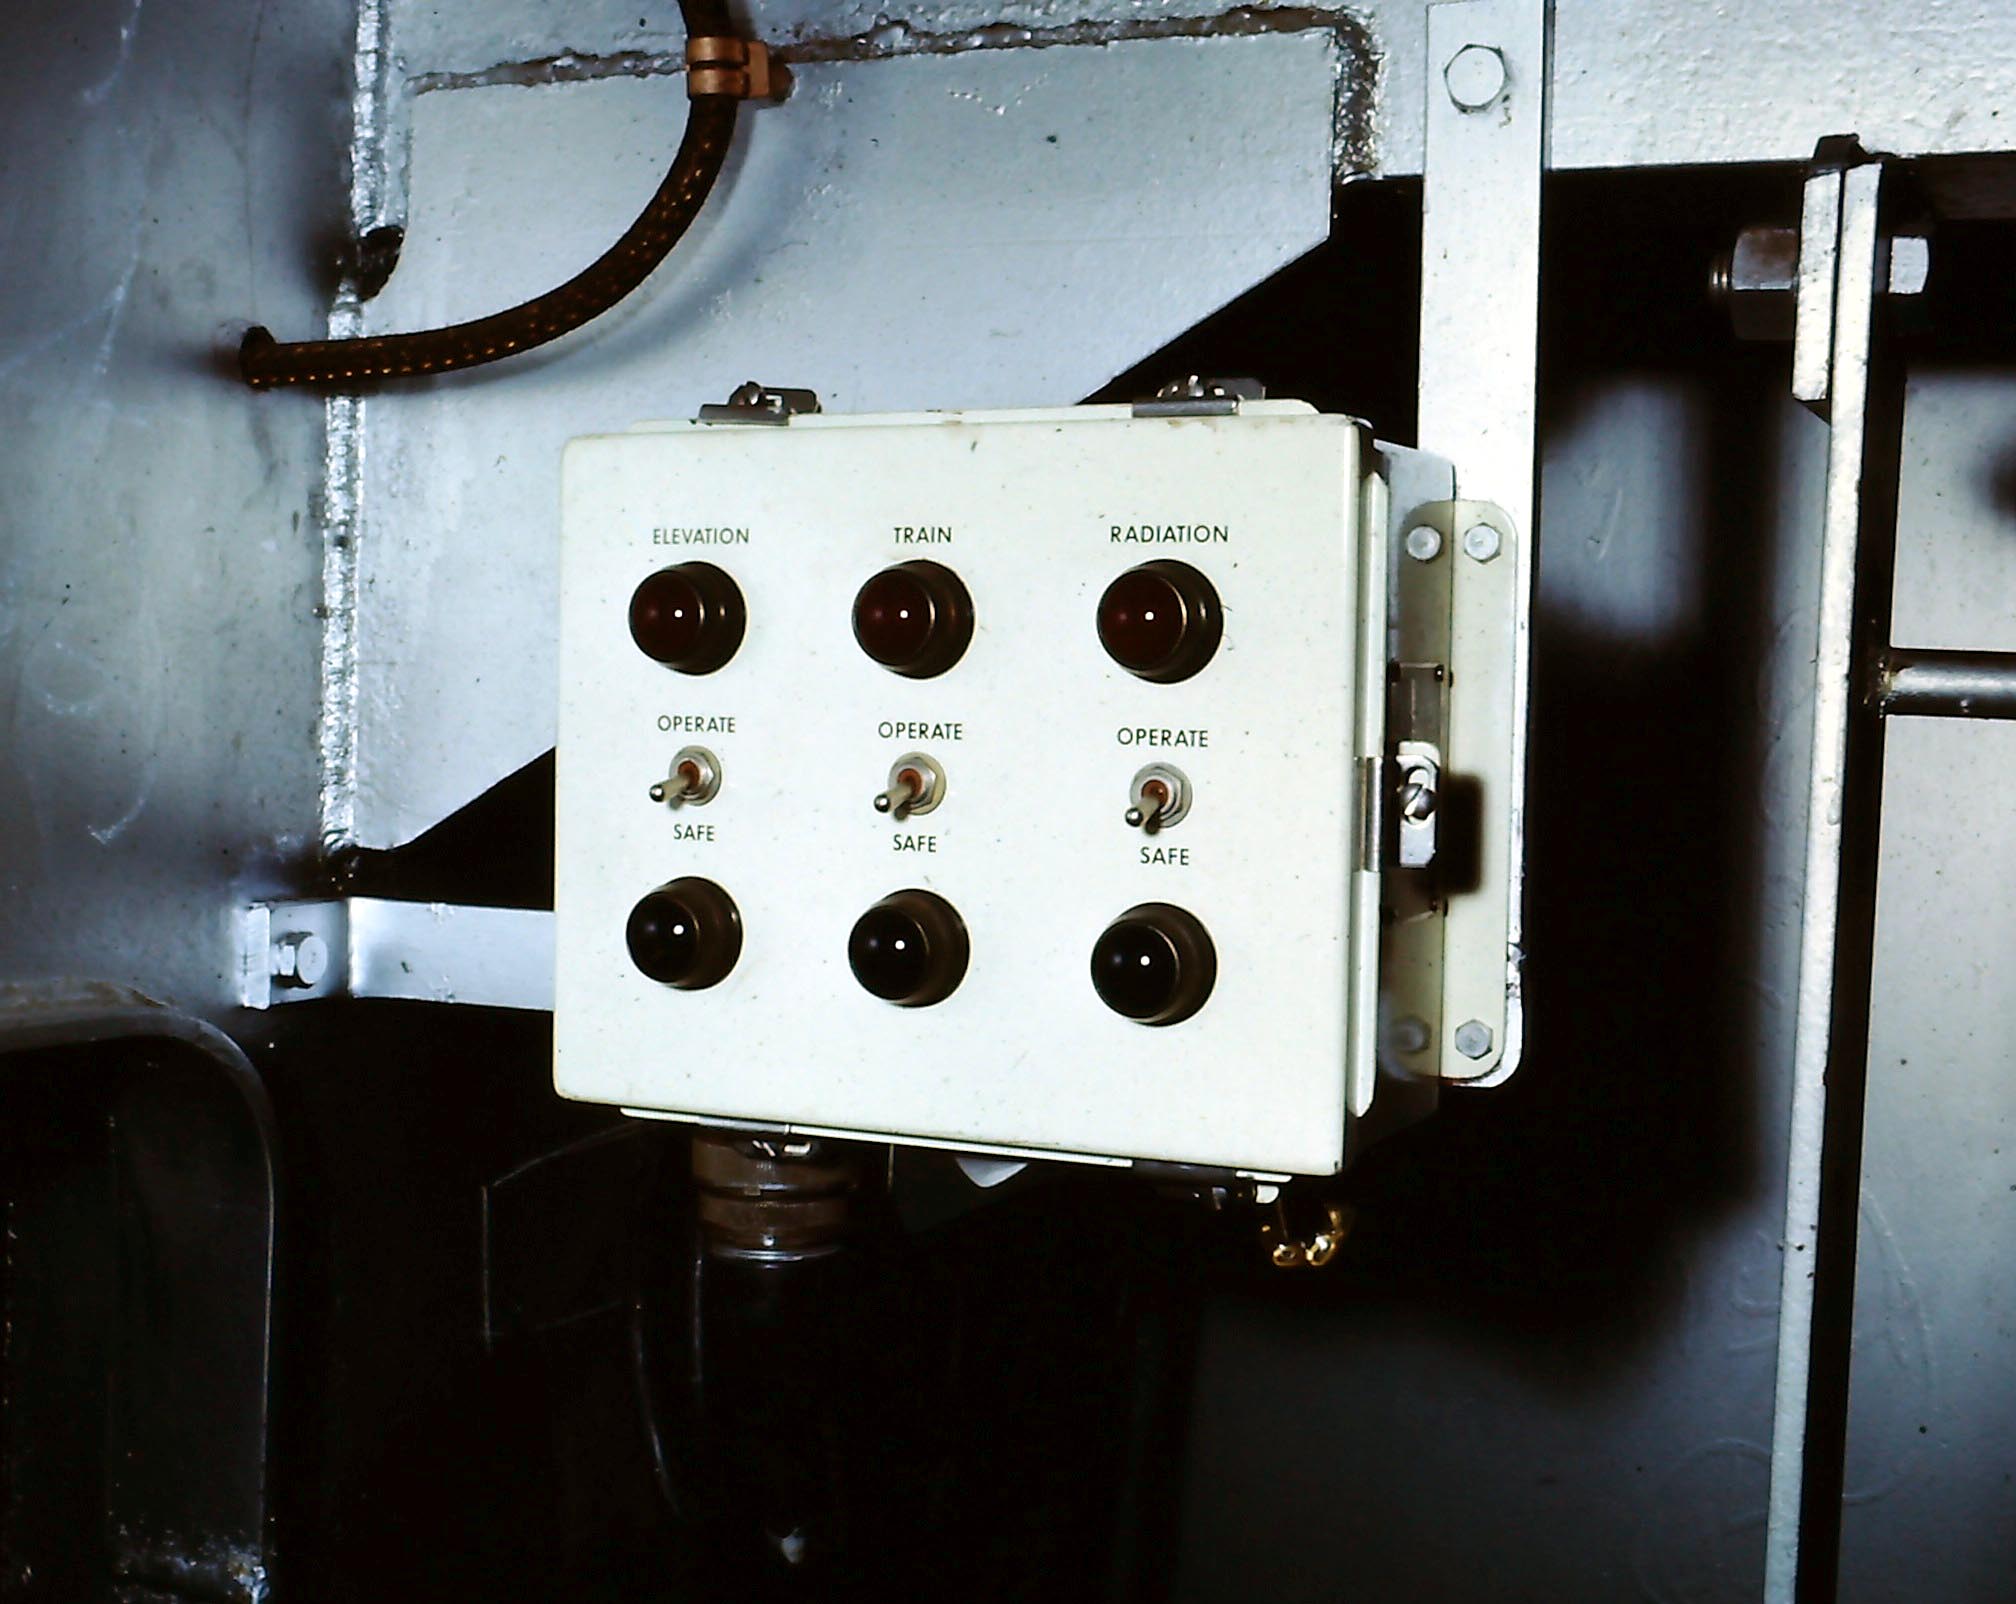 |
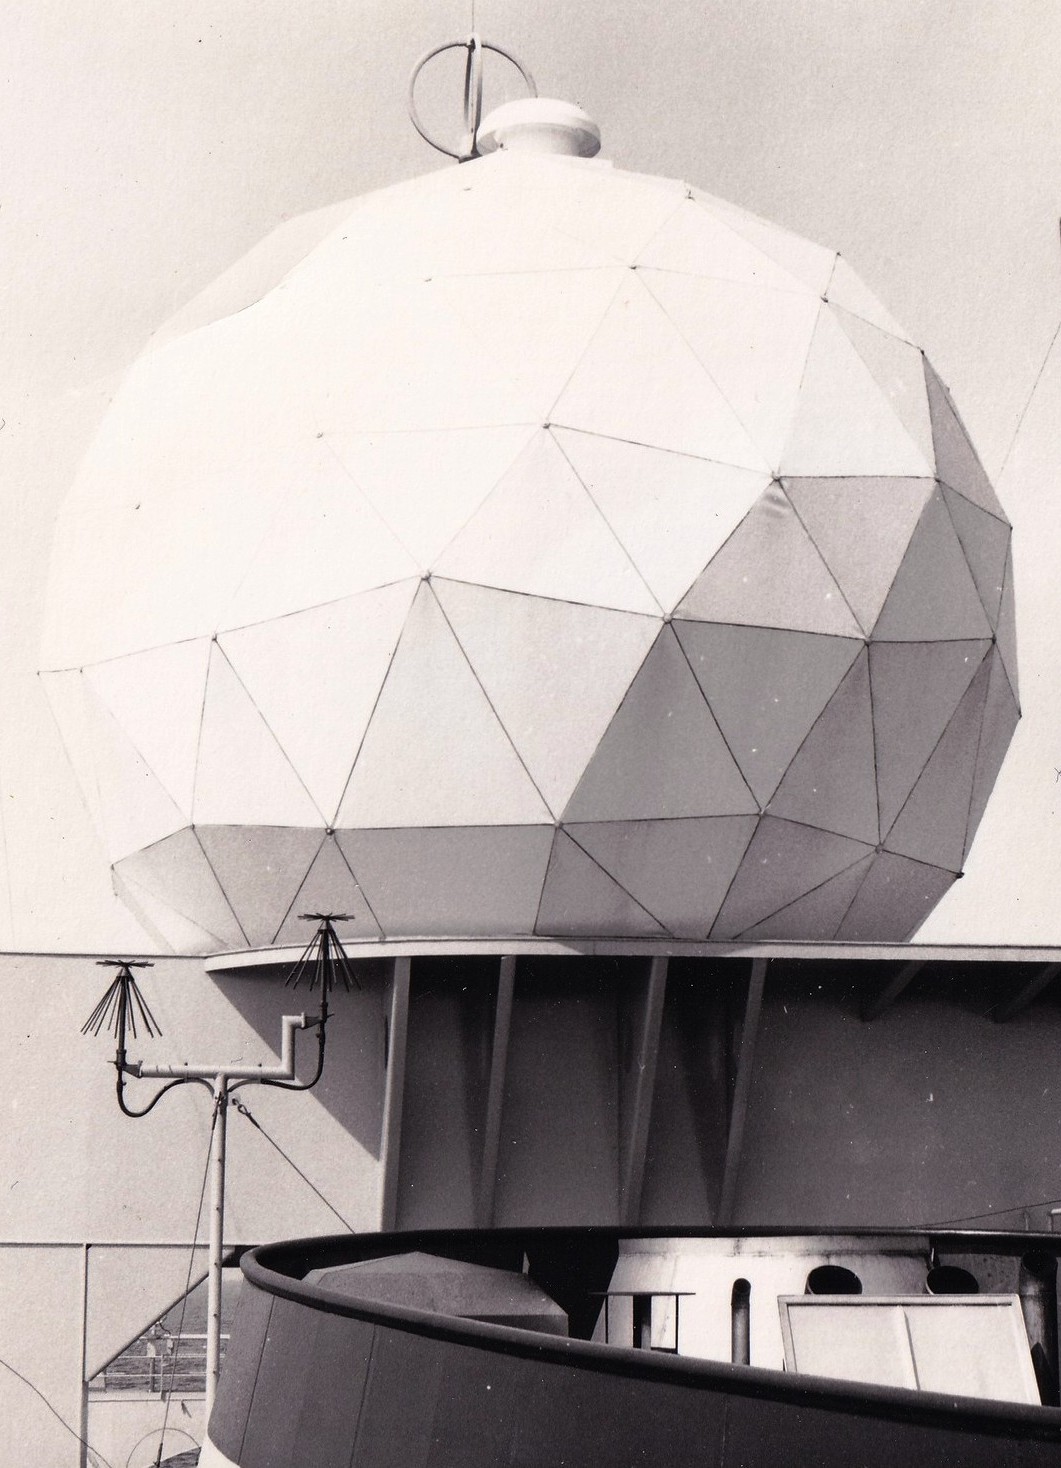
| AN/FPQ-10 radome safety switches. |
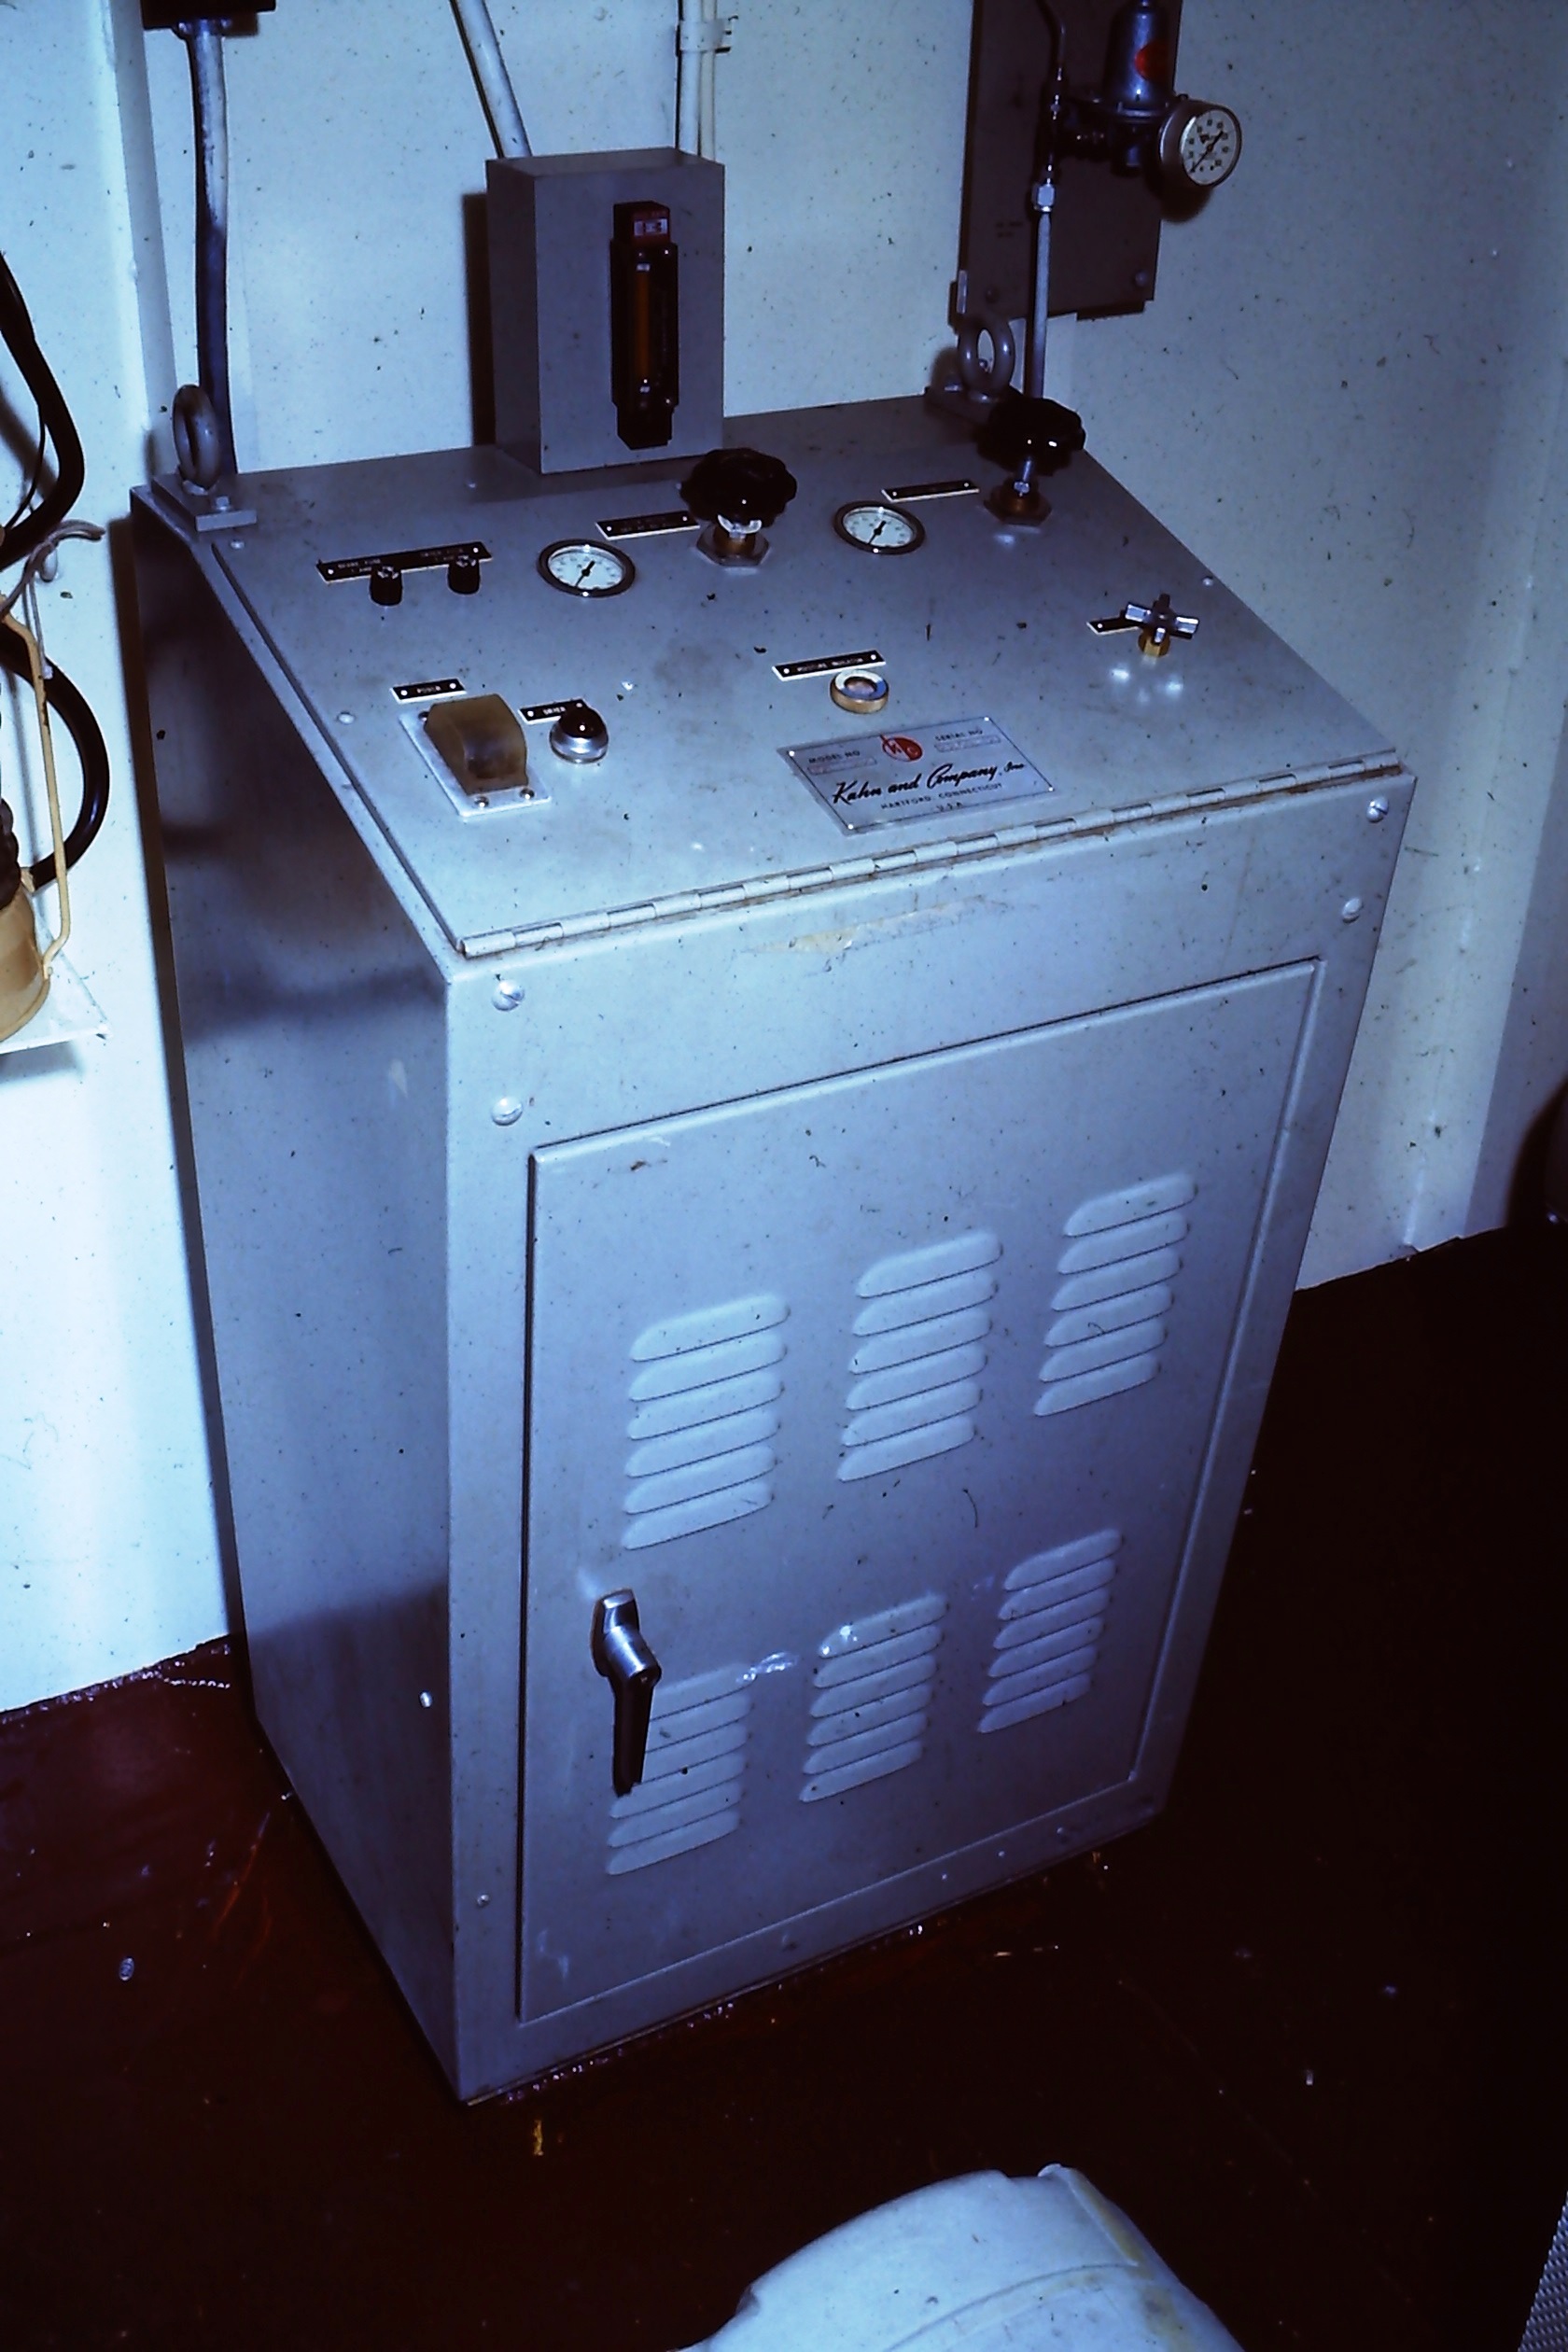 |
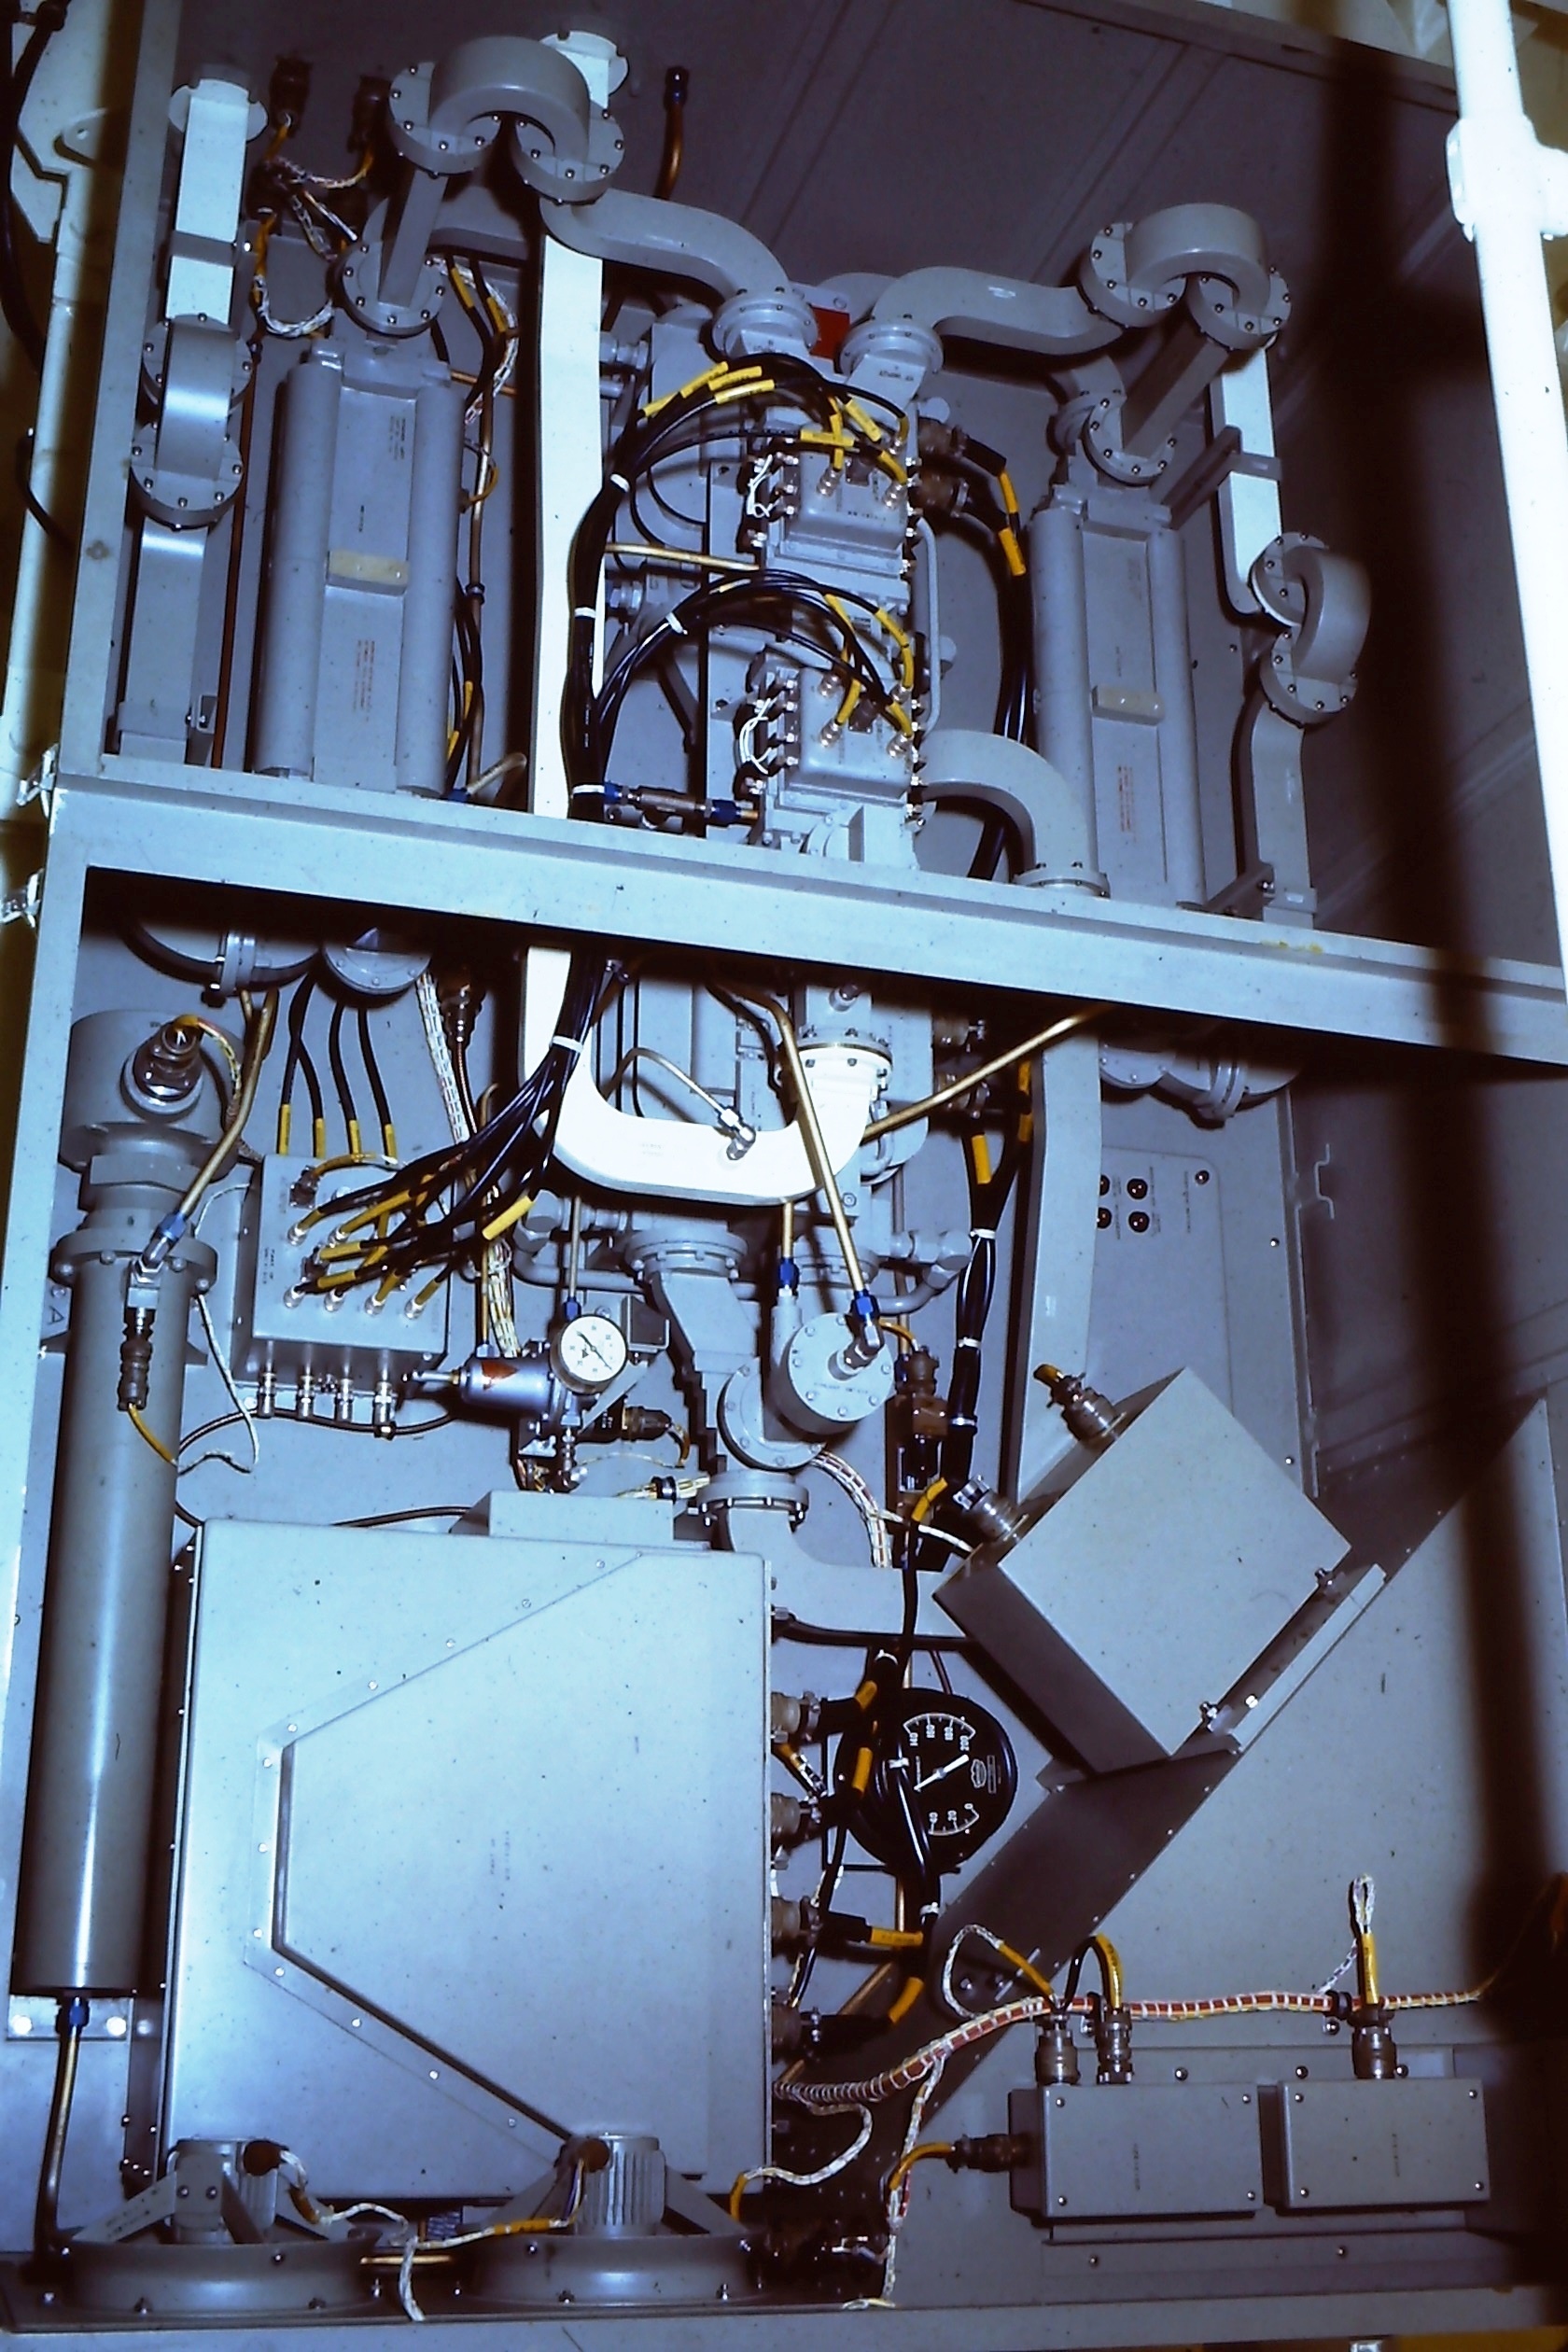
| AN/FPQ-10 - Radome pressurization system
control panel. |
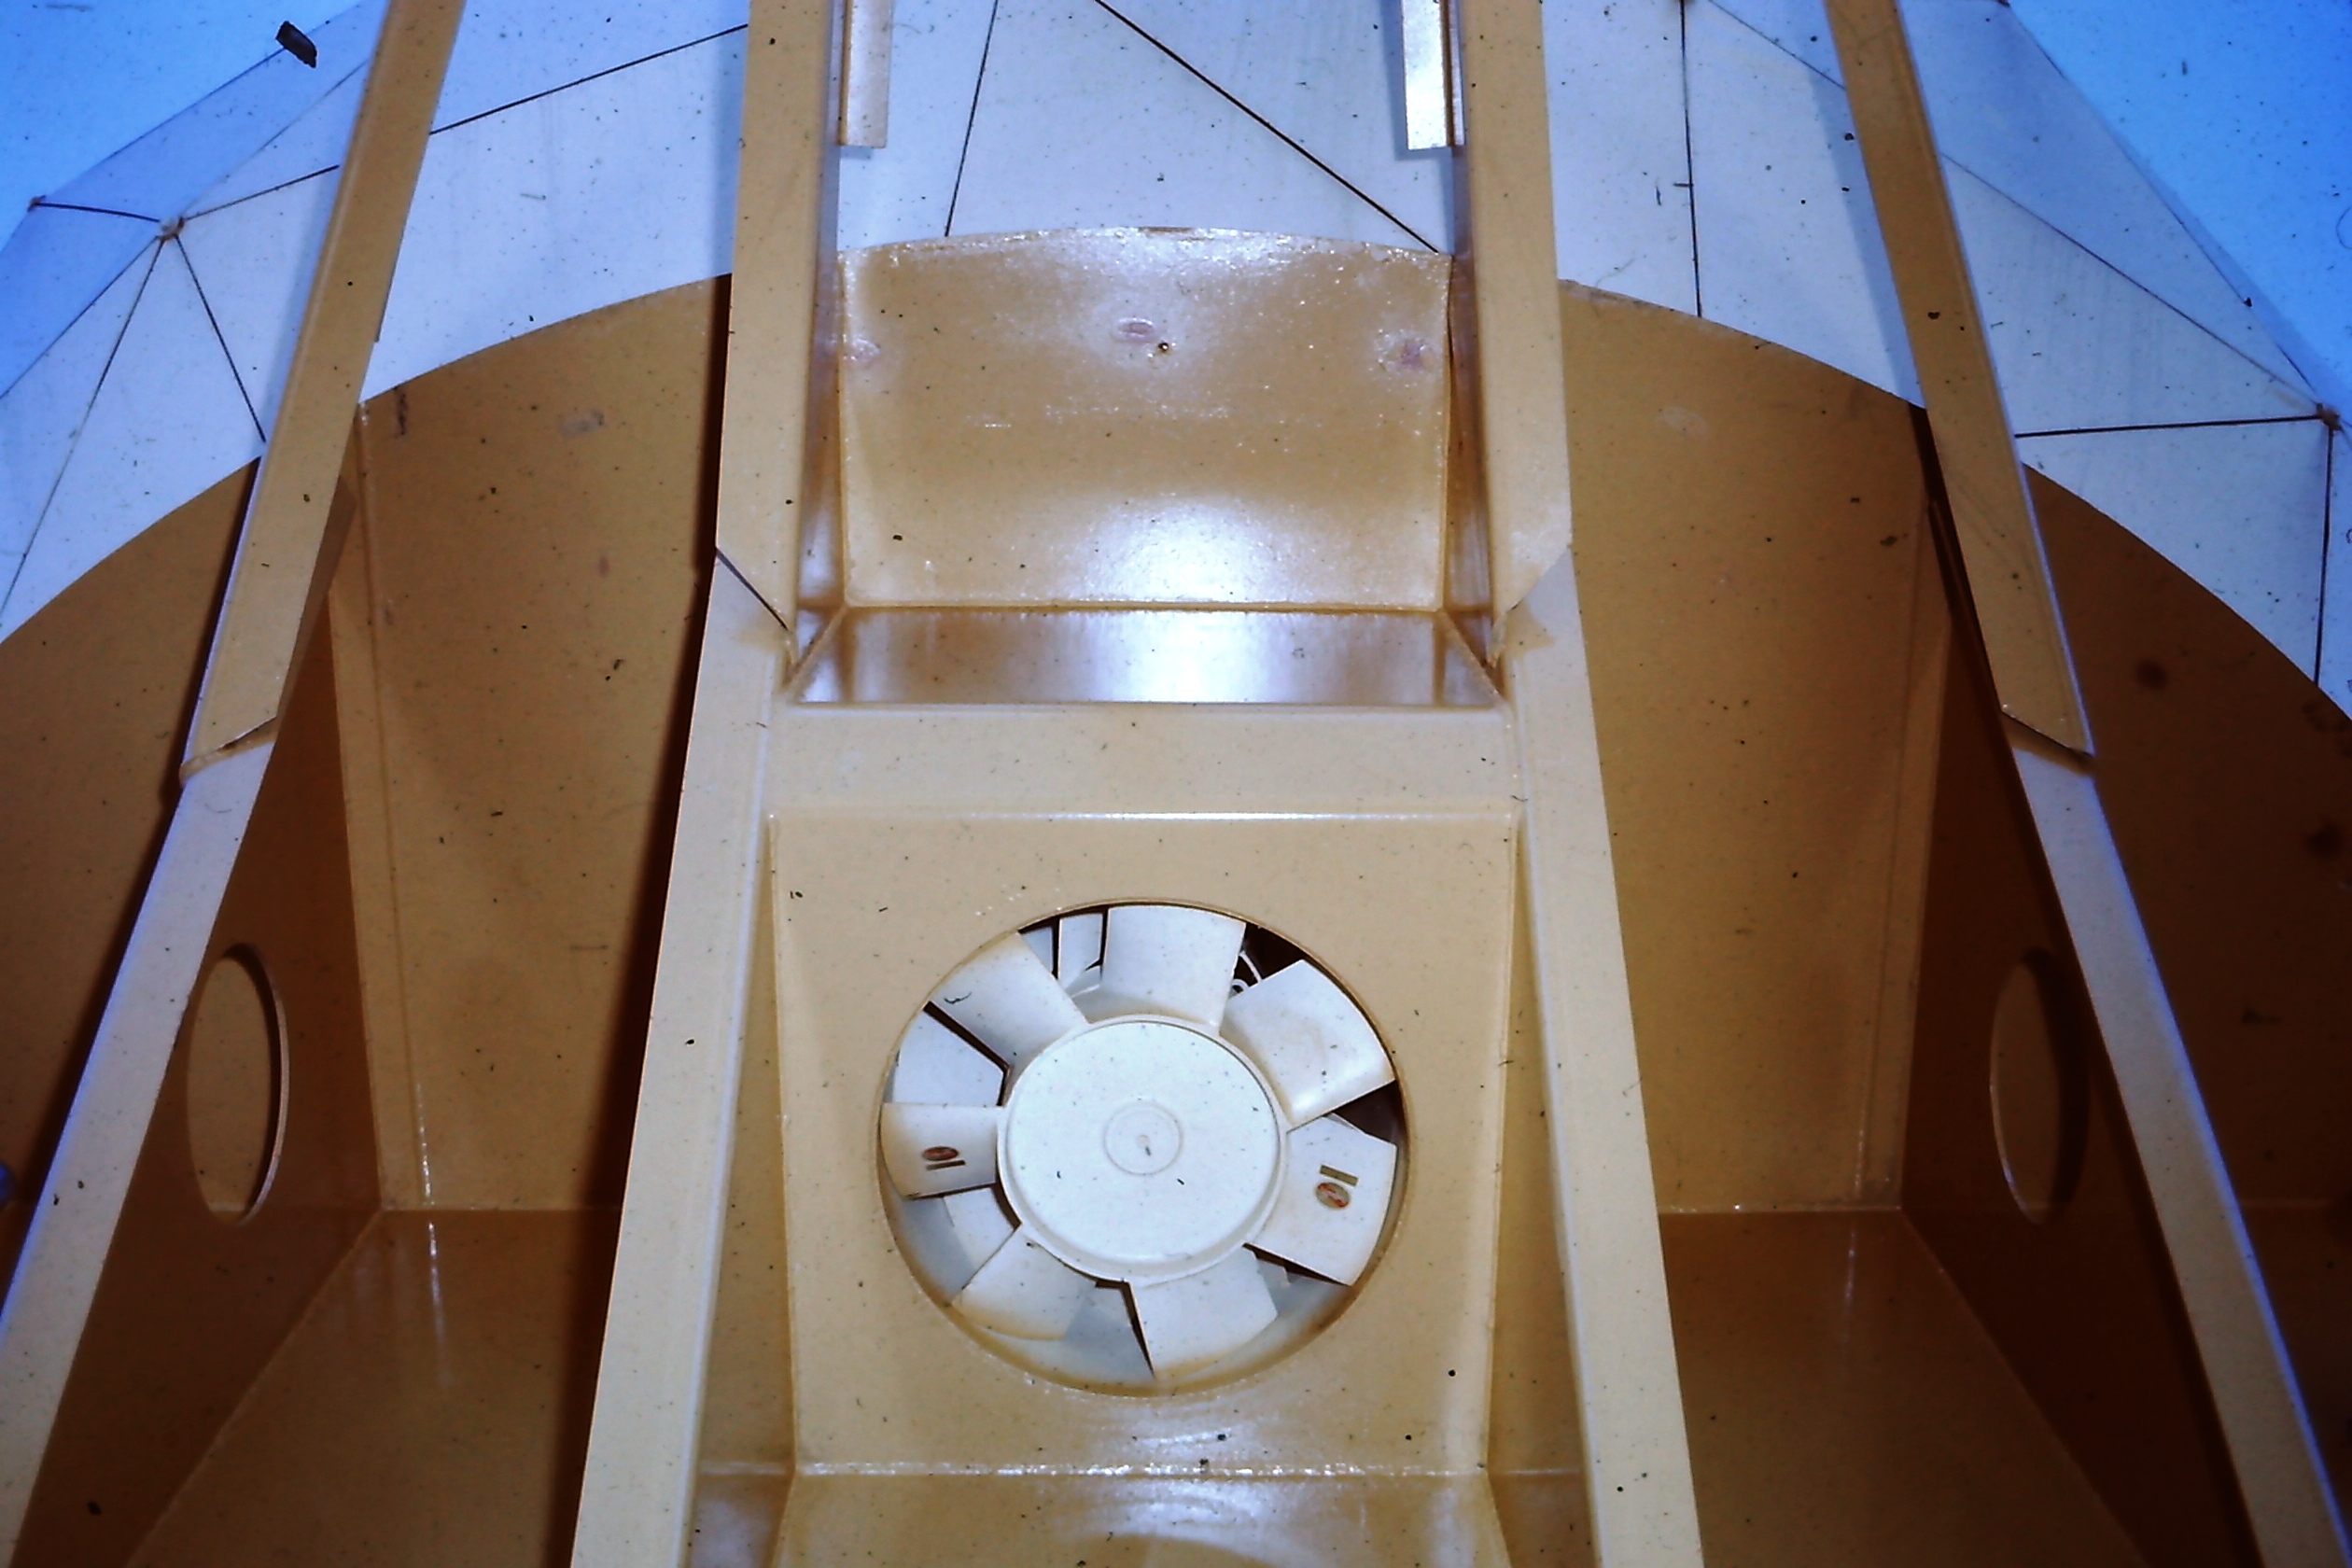 |
| AN/FPQ-10 - radome ventilation fan |
| All photos in this table by Frank Statham |
RADAR OPERATION
Frank Statham offers the following on the AN/FPQ-10. "The Ranger
cabinet did some of the target tracking. The dual trace scope on
the operator's position provided a standard "A" display (range and amplitude)
on one line and on the other, a "range gate" which was a pulse a few microseconds
wide. The operator would slide the range gate so it bracketed the
received video, using the paddle control and then pressed the TRACK
button. From that point on, the gate would follow the target's range
automatically and deliver that data to the computer. The Ranger used
resistor transistor (RTL logic gates . Because RTL would only have
a couple of gates inside each DIP ( dual in-line package) any
sort of high level logical function took up a lot of space, hence a whole
cabinet. The connections in the Ranger cabinet were thus comprised
with wire wrap connections.
There was a cabinet under the computer which took the 400 Hz synchro
information (coarse and fine) from the Mk19 gyro and dish. The computer
of course, required digital inputs so these sine wave signals had to be
translated into bits. It of course used discrete chips similar to
the Ranger and t was full of boards. On the training course, we bit
chased signals through it and came out exhausted.
The computer now had range plus space stabilized bearing and elevation.
From that it crunched the numbers to provide target data. The operator
could manually move the dish by the hand wheels visible at the front of
the PPI display. One for elevation and one for the bearing.
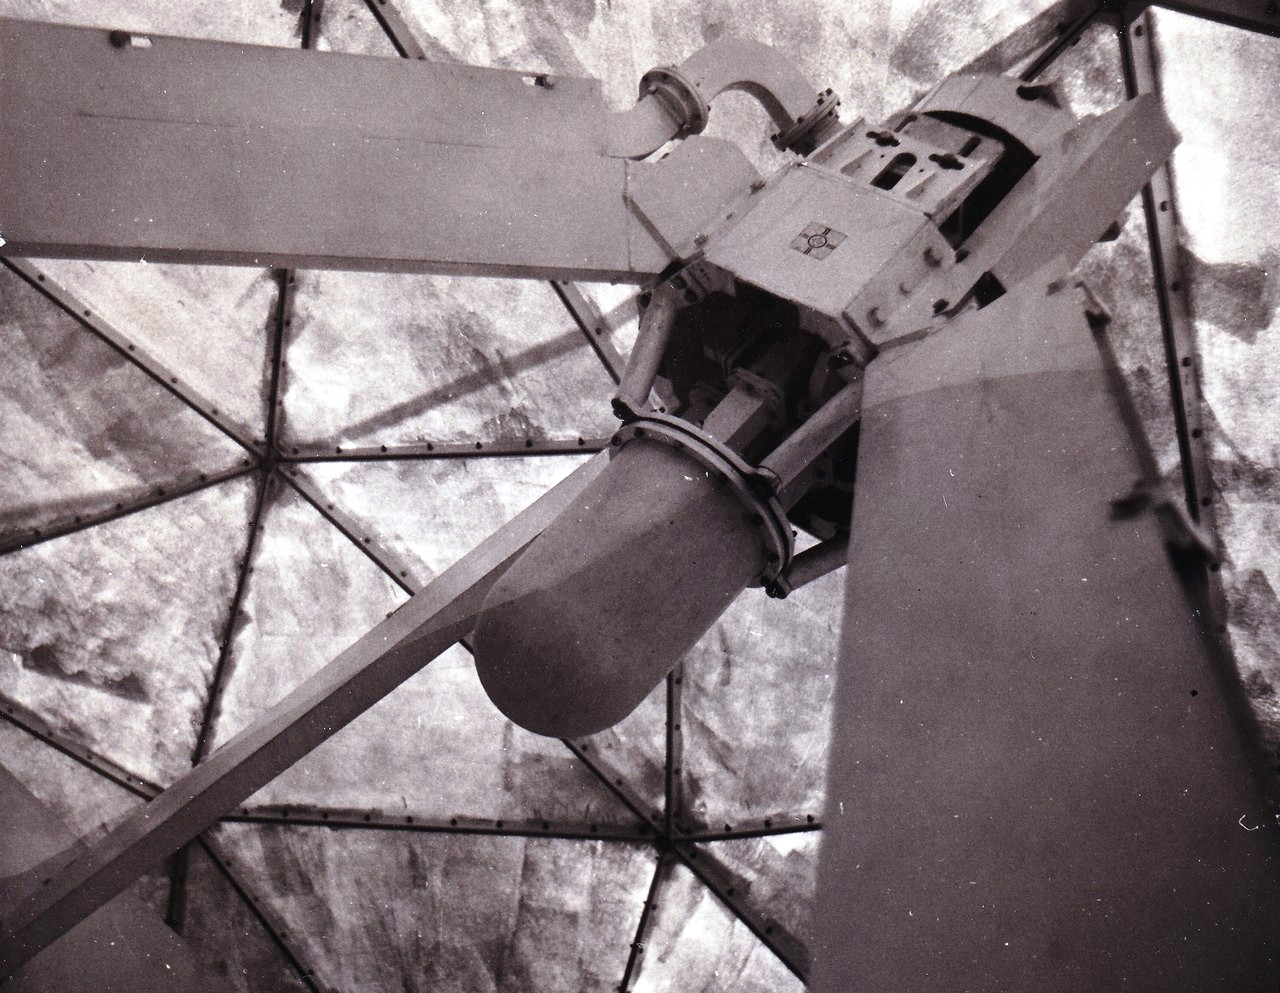
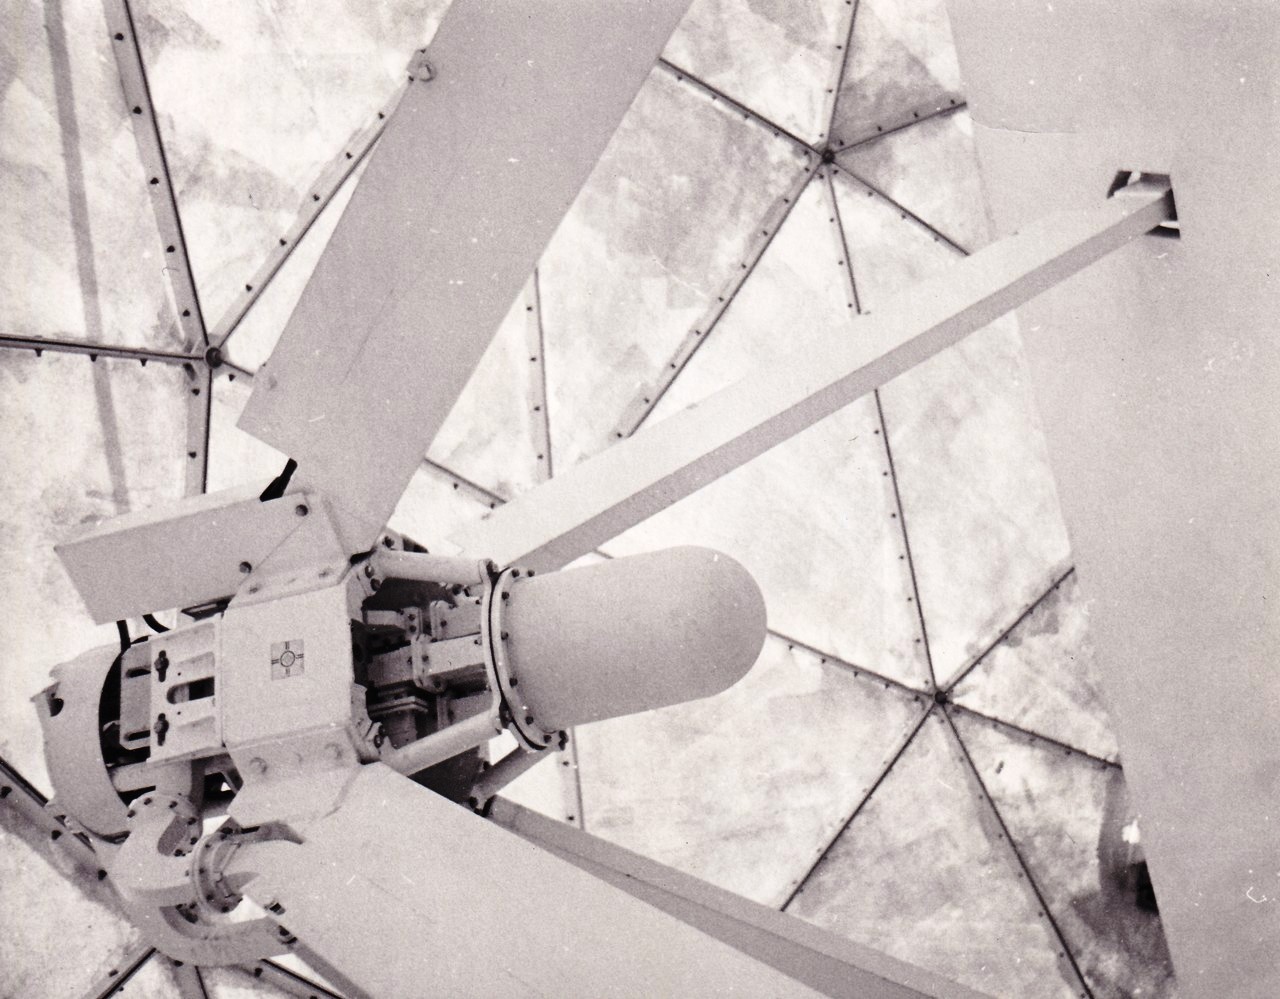
The radar was called an orthogonal mode tracker. The dish feed,
out at the focal point, was composed of five rectangular waveguide horns,
four on each side of the centre horn. The transmit energy came out
of the center horn and any target energy would be funneled into the other
four horns. If the target was a bit higher than the antenna's boresight
the received energy would impinge on the topmost of the four receive horns
before entering the bottom horn. That small time difference was the
clue needed by the computer to feed a signal into the servo system to tilt
the antenna up a bit more. The four receive horns were fed via coax,
one to each side of a chamber, in which a small antenna probe rotated,
sampling each horn in turn. Since the computer knew which horn was
being sampled, and the level of the signal at that point, it computed which
way to move the dish to keep it on target. The receiver cabinet reflected
this complexity.
There was an electronics equipment room above the Radio Operations room.
It housed the VHF and UHF air/ground radios, the telephone exchange, other
similar gear and the green racks of Sperry FPQ-10 electronics. Basically
the equipment was configured in two rows, facing each other athwart ships.
The After row was the comm gear, and the forward row had the Sperry FPQ-10
green racks. The Sperry transmitter rack was the end closest to the
port side, with the Ranger cabinet furthest away towards the starboard
side. Next to the transmitter cabinet but mounted on the bulkhead
was the power distribution panel and just visible to the right of the panel
is a doorway covering the access ladder up to the dome. Situated
in the Meteorological office was the radar operating position and computer.
Above the equipment room (if I remember the location correctly) was the
motor/generator room which took the servo signals from the operating position
and positioned the antenna. It also contained the pressurization
system".
BALLOON CONFIGURATION
Frank also describes the configuration of the weather balloon.
"The balloon carried a radiosonde to collect meteorological information.
The radar reflector dangled farthest from the balloon and the radiosonde
was positioned closer to the balloon. There was some concern about
the corners of the radar reflector piercing the balloon as it swung in
the wind. At the same time the balloon was ascending, it was also increasing
in size due to less air pressure in the upper atmosphere. . However. there
was a simple ratcheting mechanism to pay out more cord as the balloon rose
to get the reflector and radiosonde farther away from the balloon. The
ratcheting mechanism would extend the distance between the reflector and
the balloon by several yards. The danger was taht of the reflector being
blown into the balloon and deflating it.
Balloon runs would end when the balloon burst. The 'A' scope display
would rapidly oscillate in amplitude indicating that the reflector was
tumbling. Before launch, it took an almost an hour for the "met lads" to
carefully calibrate the radiosonde. On occasion, and upon being launched
off the stern, the weather balloon, lost lift and was momentarily dunked
into the ocean before continuing its ascent. One can only imagine the looks
of concern from the met people whenever this event occurred. Since none
of the sounding gear could be retrieved after use, the ship had to carry
a 6 week supply of radar reflectors, radiosonodes, balloons and hydrogen
gas.
In 1968 there were four balloon launches per day at six hour intervals.
This dropped to two per day by 1976. Most balloons reached an altitude
of 115,000 to 120,000 feet. In 2021, weather balloons are launched
across Canada from Port Hardy, BC., Prince George B.C. and
Arctic stations.
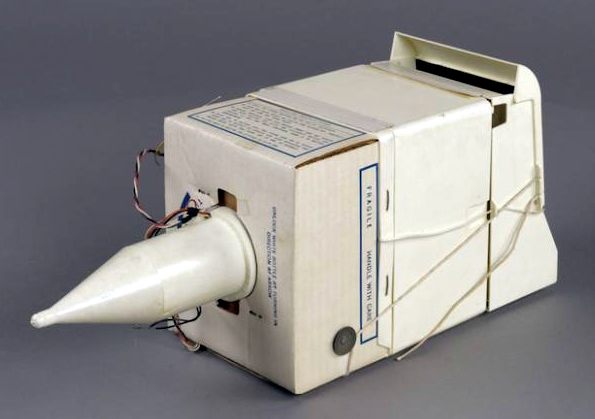
OPTICAL TRACKER
The optical tracker was a device to help the FPQ-10 radar acquire the
balloon immediately after release. Close in, radar operators had
to deal with side lobes and sea clutter etc and it often took some time
to find the balloon. The optical tracker was eventually removed because
it was not possible to see the balloon in the dark and no one wanted to
venture out into the cold wind or rain to use it. However, the operators
got very proficient and located the balloon with the hand controllers which
were part of the radar system".
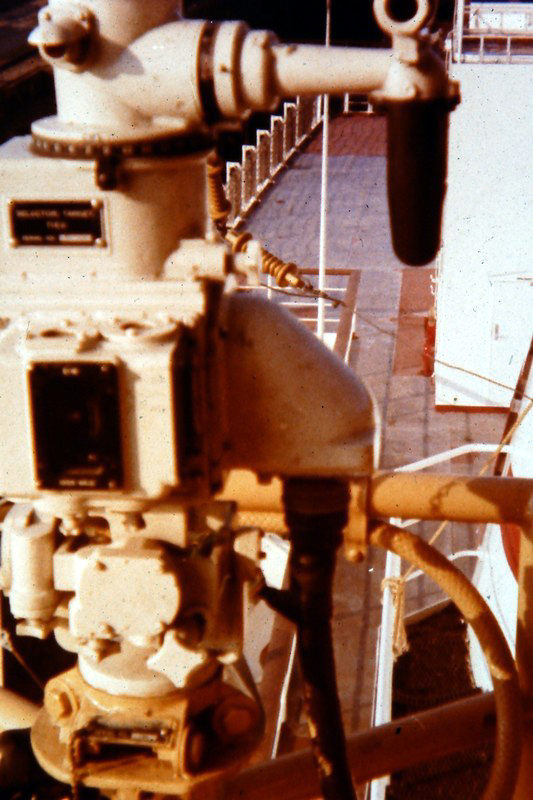 |
| The optical tracker was used to track the weather balloon immediately
upon release. It was likely tied into the servo system to help the radar
acquire the balloon.This example has some missing parts. Eventually, the
trackers were removed from Quadra and Vancouver. (Photo by by
Frank Statham) |
COMPUTER
The computer used in the FPQ-10 had a word length of 21 bits (which
is a bit unusual) with the most significant bit being on the left side
of the word. Memory complement was 4,000 words of core memory. It used
a very simple but limited instruction set. There were very
few instructions available to do all the calculations. About 13 in total.
Here are some of them:
TRA Transfer
TRM Transfer on minus
MLY Multiply
ADD Add
SUB Subtract
NOP No operation
IO - ?
There was no divide instruction. You had to develop a subroutine if
you wanted to divide.
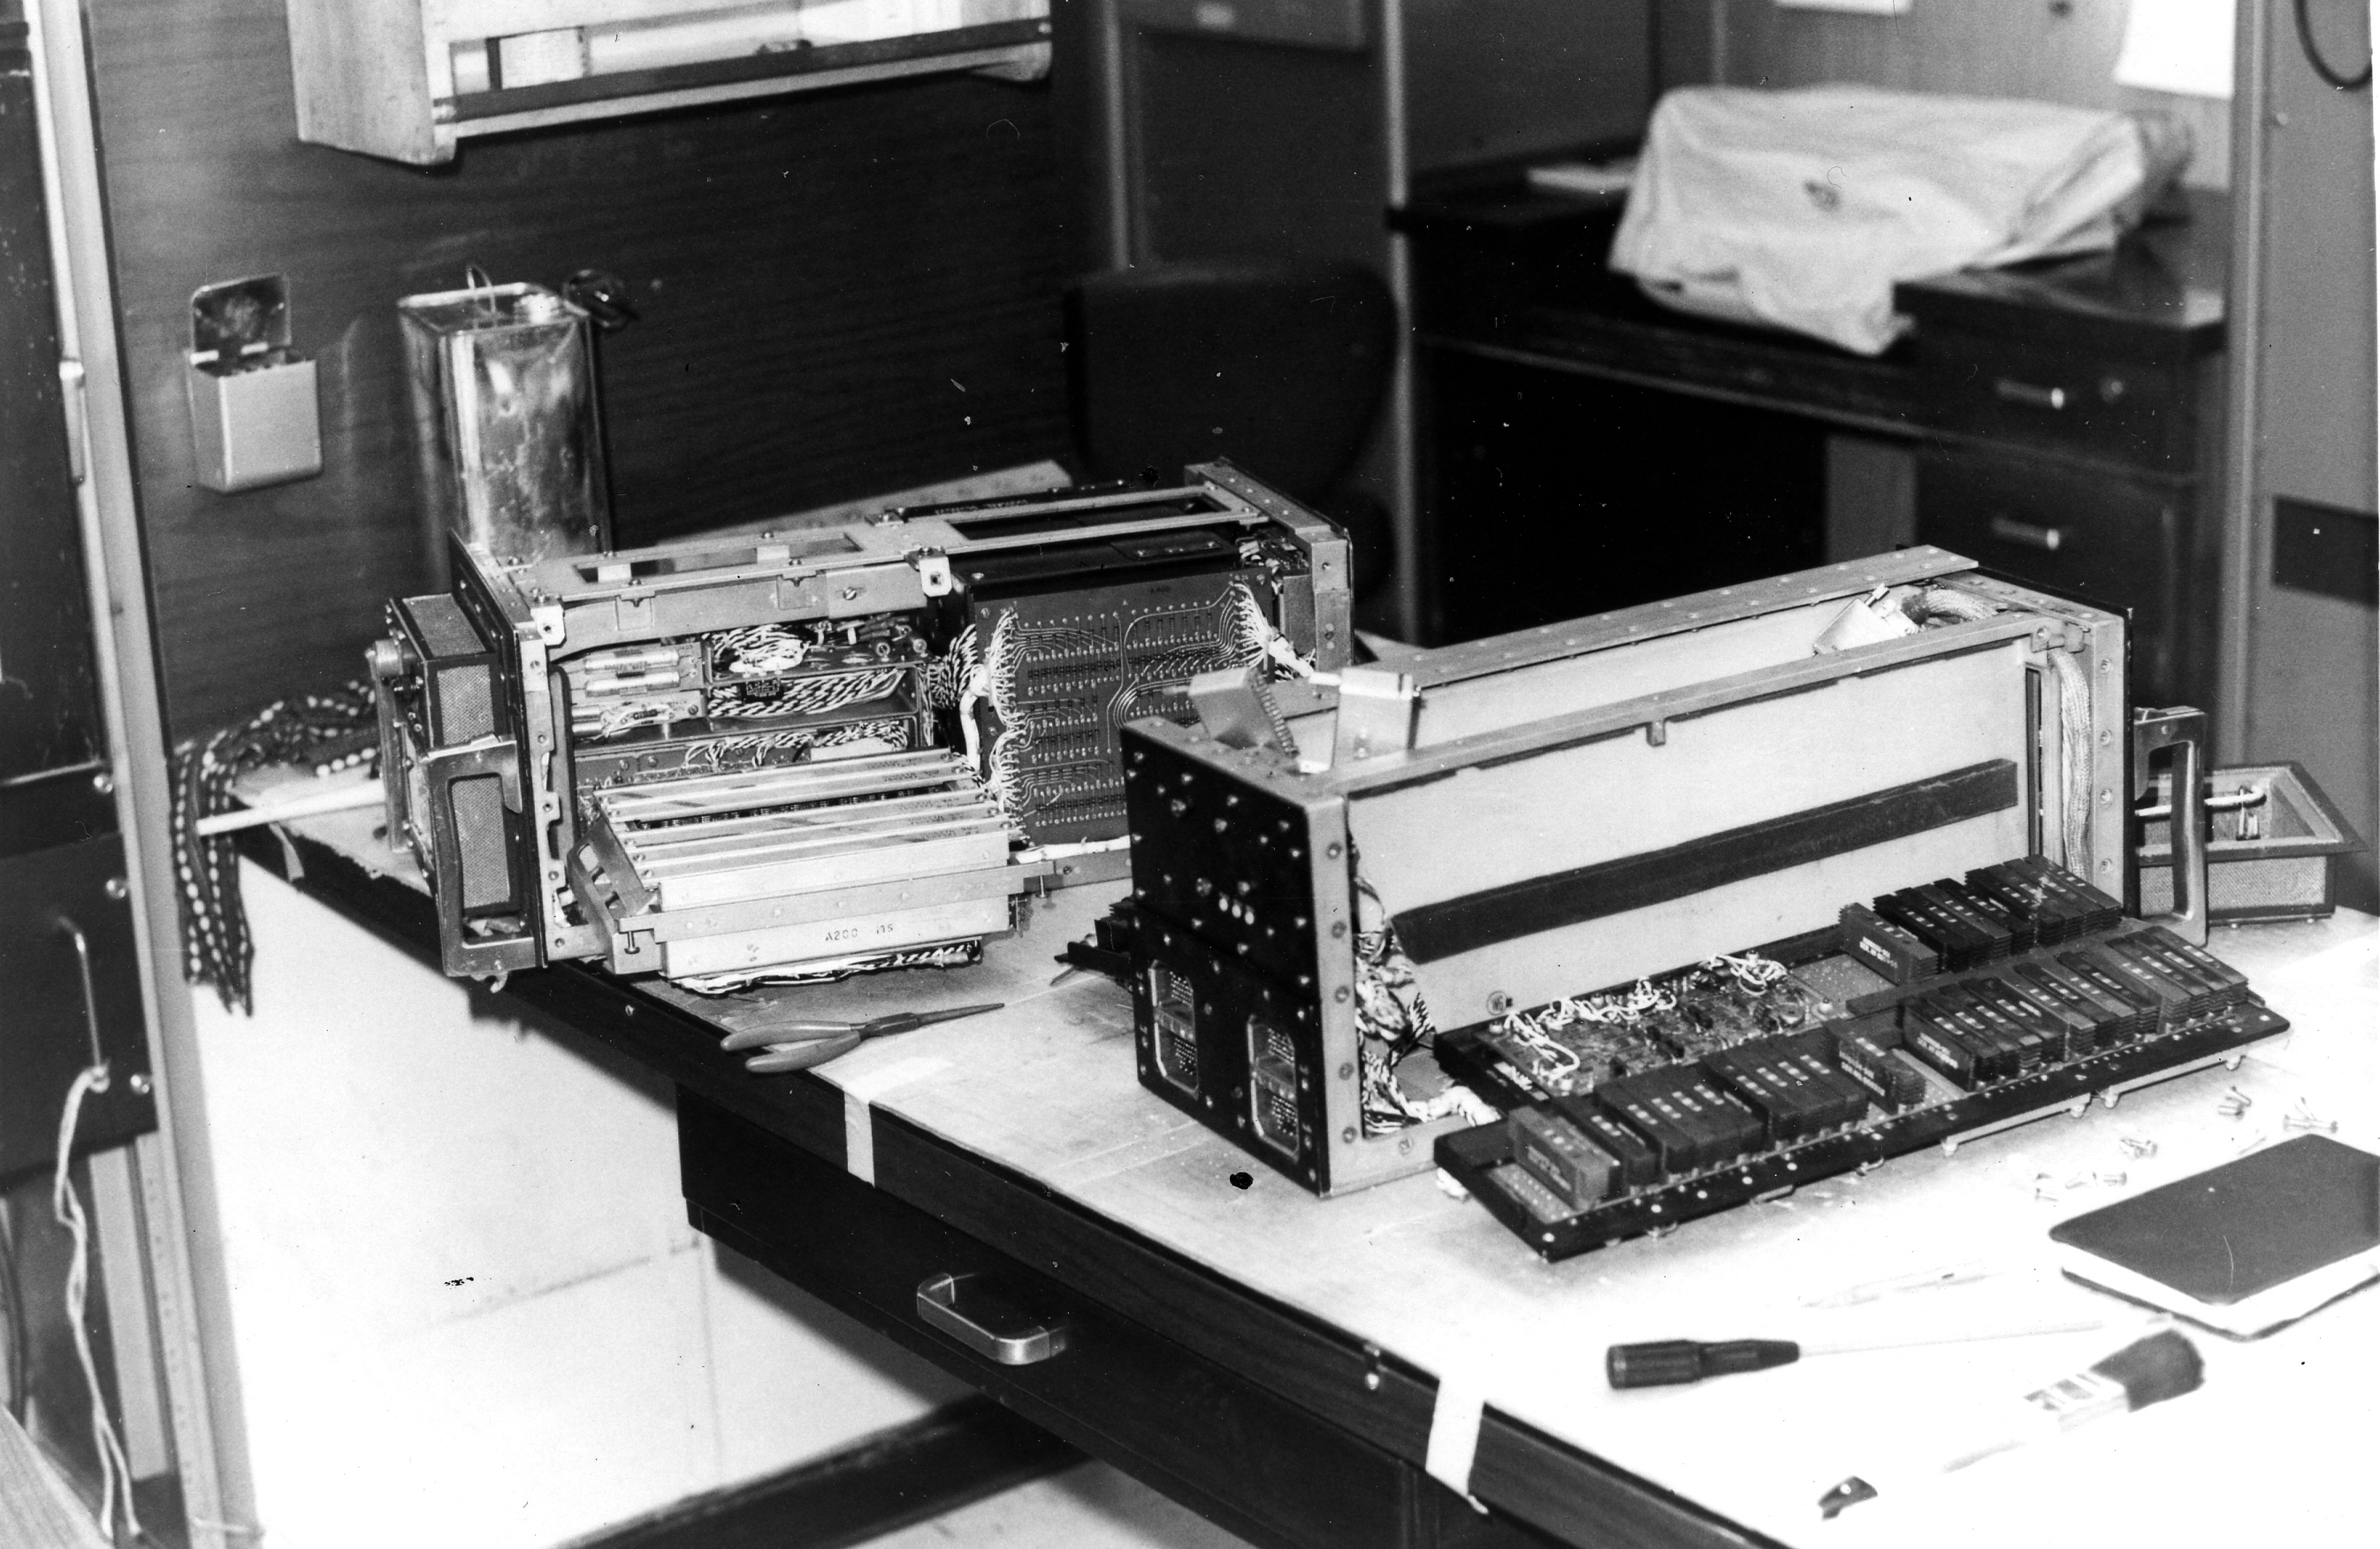 |
Two views of the Computer Memory Unit (CMU).
One of these was a spare parts unit. Click on image to enlarge. (Photo
by Jack Cain) |
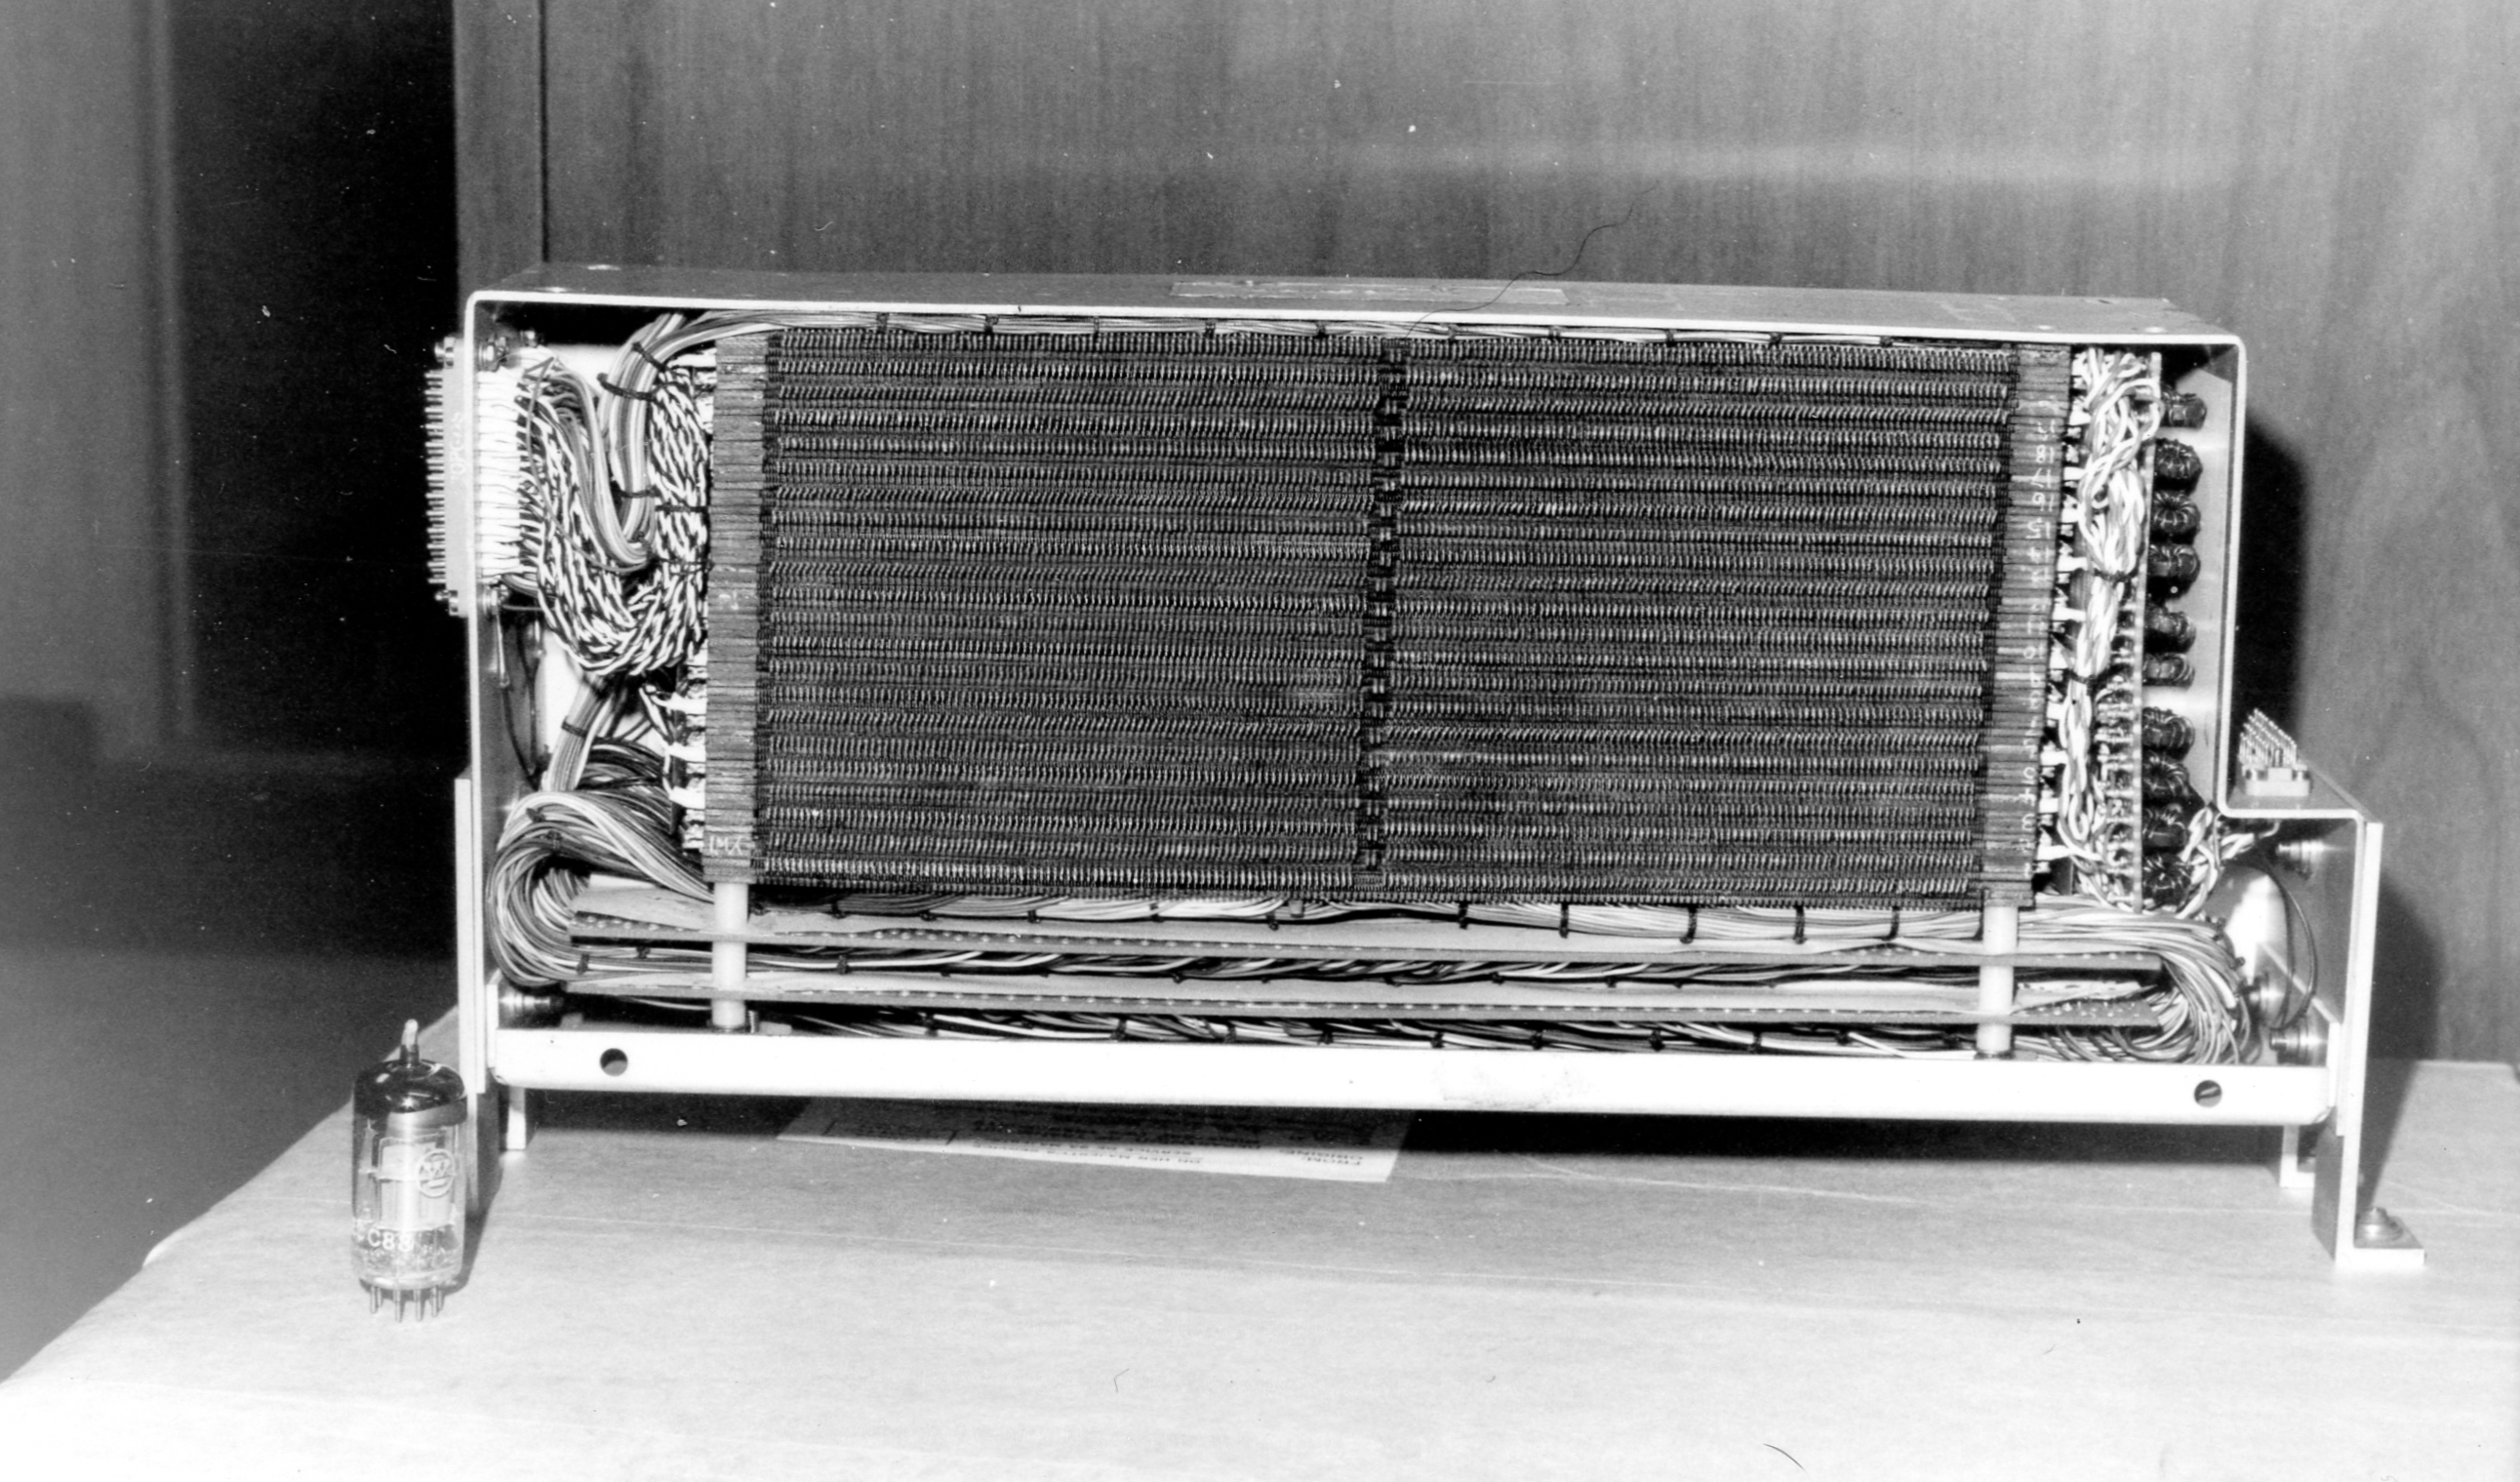 |
View of the CMU 4k word core plane. Click
on image to enlarge. (Photo by Jack Cain) |
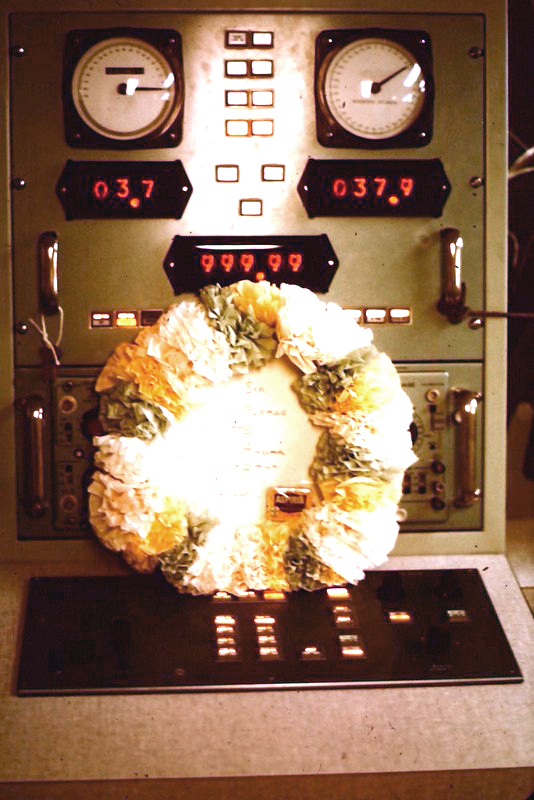 |
| Control console with the Nixie tubes illuminated. At the left
was Elevation. Right was Azimuth and center was Range. There was
likely a control to switch between using a ship's heading as a reference,
or true north as a reference.
Some wise guy left the wreath on the control console when personnel
were dealing with a particularly knotty problem with the radar system.
.( Photo by by Frank Statham) |
RADIOSONODES
The radiosonde is a small instrument package that is suspended below
a balloon filled with either hydrogen or helium. As the radiosonde is carried
aloft it basically measures pressure, temperature, and relative humidity.
Through international agreement, the 400 to 406 MHz and 1675 to 1700
MHz bands of the electromagnetic spectrum are reserved exclusively
for these tiny airborne weather stations to radio their findings back to
a ship or a ground station. Regardless of the model, radiosonodes were
tracked with radar.
There were at least two types of radiosonodes used on Quadra (launched
1967) and Vancouver (launched 1965) so chronology must be taken into
account. In 1963, VIZ (107 MHz) radiosonodes were introduced into Ocean
Station Papa to replace the old Canadian designed Chrometeric radiosonodes.
By 1974, Ocean station Papa was converted from 107 to 403 MHz radiosonodes.
Radiosonodes were built by Valcom in Guelph, Ontario under contract
to the VIZ Mfg.Company located in Philadelphia.VIZ also manufactured radiosondes
for National Weather Service and the US military.
These older radiosondes were much bulkier and heavier than today's instruments.
They used vacuum tubes which were powered by a bulky 115V battery.
This battery was activated by submersing it in water for 2 minutes.
It could give you quite a jolt if you accidentally touched the contacts.
Temperature and humidity sensors were pretty crude by modern standards.
A temperature sensor consisted of a thermistor which was a temperature
sensitive resistor. It was also bulky and very sensitive to solar
radiation at high levels. The humidity sensor used a carbon hygristor,
whose resistance varied with humidity. While it might have been crude by
todays standards, it was quite an upgrade to the lithium-chloride hygristor
that was used in the 1960s.
The aneroid operated a penarm that traveled across a commutator bar
as the sonde ascended. The bar was calibrated so that you knew what
the pressure was at a given contact point. The bar switched the active
sensor back and forth from temperature and humidity as it ascended.
 |
 |
 |
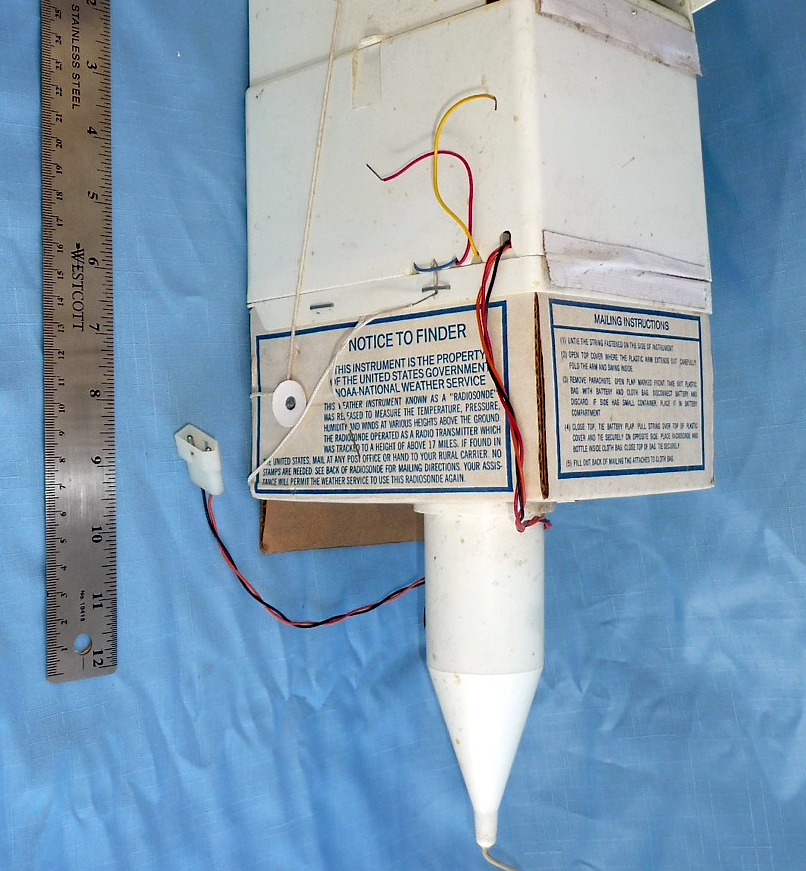
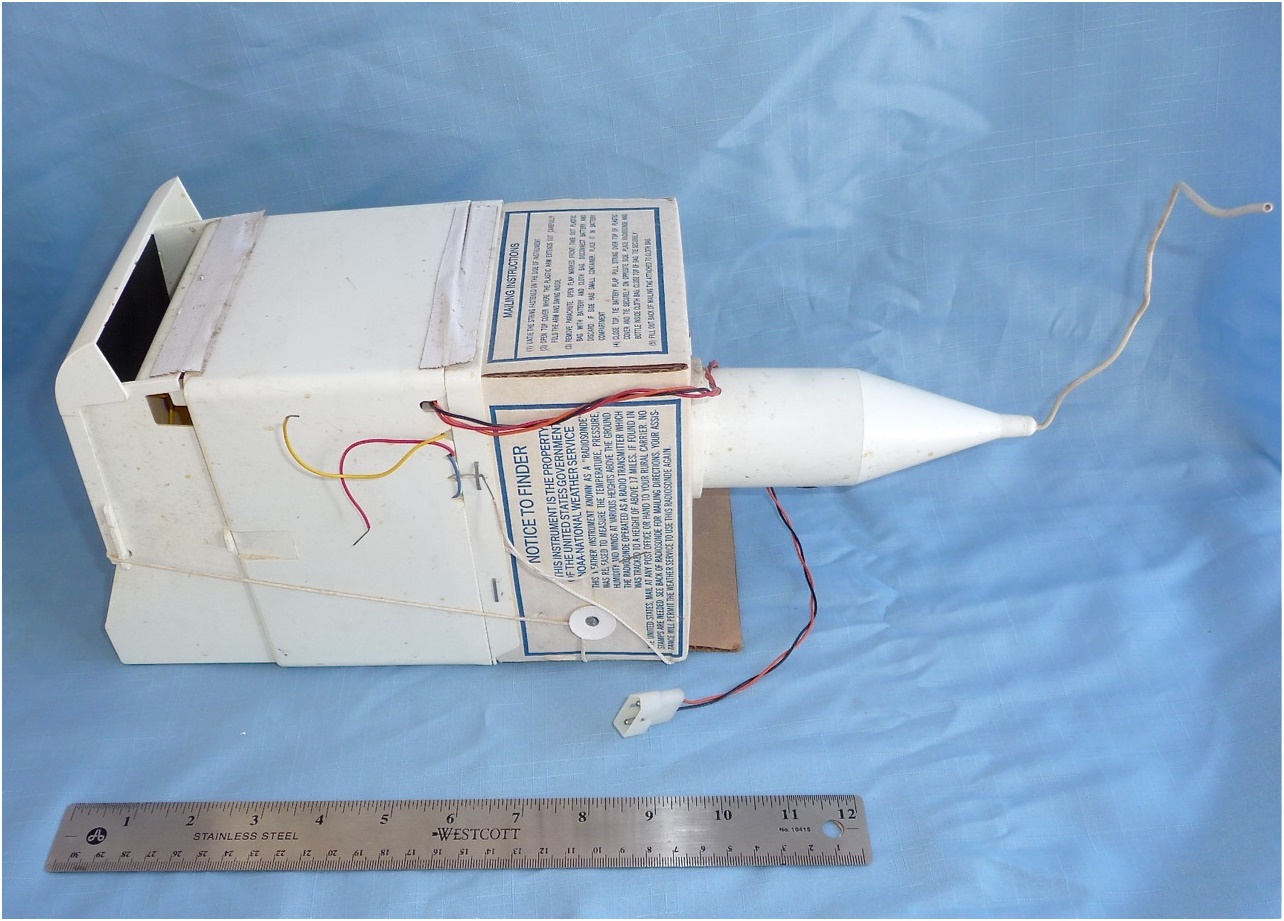
| This is an example (circa 1982) of radiosonode for
the 400 MHz band. It is not known of this exact model was used aboard Quadra/Vanciyver
but it should be close enough, Click on amy image to enlarge. (Photos
courtesy of the Radiosonode Museum) |
The meteorology tech sat at a rack containing the receiver
and a 8-10 inch wide strip recorder. The paper strip came out on
a surface that was suitable for writing on. As the balloon
ascended he would write notes on the paper. The received signal was
just a series of rough buzzes. Internally, the radiosonode had a
barometer with a arm which wiped across a series of different contacts
as the pressure changed.
Terry Sampson provides some additional details about radiosonode operation.
"The radiosonde received VLF signals in the 10 to 20 kHz band
from Balboa Panama plus two other VLF stations . Then, it re-transmitted
all three VLF signals to the Quadra over one UHF radio link
Because the received time relationship between all three VLF signals would
remain constant, Quadra's equipment would then measure the time difference
between the three VLF signals to determine the speed and direction
of the wind at the radiosonode. The radiosonode itself would not process
any data.
By 1974, the radiosonode sent all if its information over a UHF
radio link in the 403 to 407 MHz band. The VLF receive antenna was simply
a piece of short wire. The RF from the UHF antenna did not cause any overload
in the VLF receiver."
In 1978, the ADRES minicomputer system was introduced at the receiving
point. Wind data was calculated automatically but a operator had
to extract the raw meteorological data,
This document summarizes
the radiosonode changes whixch occured at Ocean Station Papa.
Credits and References:
1) Frank Statham <fstatham(at)gmail.com>
2) Modulator https://courses.comet.ucar.edu/pluginfile.php/3695/mod_imscp/content/1/transmitter_and_modulator.html
3) Terry Sampson, [Terry.Sampson(at)dfo-mpo.gc.ca]
4) Jack Cain ve7dbk(at)gmail.com
5) Radiosonode History https://library.wmo.int/doc_num.php?explnum_id=9592
6) David Watson <ddwatson88(at)gmail.com>\
7) Radiosonode Museum of North America https://radiosondemuseum.org
Back To Quadra
MArch 14/23